UNITED STATES
SECURITIES AND EXCHANGE COMMISSION
WASHINGTON, D.C. 20549
FORM 10-K
[X] ANNUAL REPORT UNDER SECTION 13 OR 15(d) OF THE SECURITIES EXCHANGE ACT OF 1934
For the fiscal year ended October 31, 2020
[ ] TRANSITION REPORT UNDER SECTION 13 OR 15(d) OF THE SECURITIES EXCHANGE ACT OF 1934
Commission file number: 001-38154
CODA OCTOPUS GROUP, INC.
(Exact name of registrant as specified in its charter)
| Delaware | 34-200-8348 | |
| (State or other jurisdiction of | (I.R.S. Employer | |
| incorporation or organization) | Identification Number) |
3300 S Hiawassee Rd, Suite 104-105, Orlando, Florida, 32835
(Address, Including Zip Code of Principal Executive Offices)
407 735 2402
(Issuer’s telephone number)
Securities registered under Section 12(b) of the Exchange Act:
COMMON STOCK, $0.001 PAR VALUE PER SHARE
Securities registered under Section 12(g) of the Exchange Act:
NONE
| ● | Indicate by check mark if the registrant is a well-known seasoned issuer, as defined in Rule 405 of the Securities Act. Yes [ ] No [X] |
| ● | Indicate by check mark if the registrant is not required to file reports pursuant to Section 13 or Section 15(d) of the Act. Yes [ ] No [X] |
| ● | Indicate by check mark whether the registrant (1) has filed all reports required to be filed by Section 13 or 15(d) of the Exchange Act during the past 12 months (or for such shorter period that the registrant was required to file such reports), and (2) has been subject to such filing requirements for the past 90 days. Yes [X] No [ ] |
| ● | Indicate by check mark whether the registrant is a large accelerated filer, an accelerated filer, or a non-accelerated filer or a smaller reporting company. |
| Large accelerated filer [ ] | Accelerated filer [ ] | |
| Non-accelerated filer [ ] | Smaller reporting company [X] |
| ● | Indicate by check mark whether the registrant is a shell company (as defined in Rule 12b-2 of the Act). Yes [ ] No [X] |
| ● | State issuer’s revenues for its most recent fiscal year: $20,043,810 |
| ● | State the aggregate market value of the voting and non-voting common equity held by non-affiliates computed by reference to the price at which the common equity was last sold, or the average bid and asked price of such common equity, as of April 30, 2020 representing the last business day of the registrant’s most recently completed fiscal year: approximately $27,325,000 |
| ● | State the number of shares outstanding of each of the issuer’s classes of common equity, as of the latest practicable date: 10,751,881 as of January 28, 2021. |
TABLE OF CONTENTS
| 2 |
FORWARD-LOOKING STATEMENTS
This Form 10-K includes forward-looking statements within the meaning of Section 27A of the Securities Act of 1933, as amended, which we refer to in this annual report as the Securities Act, and Section 21E of the Securities Exchange Act of 1934, as amended, which we refer to in this annual report as the Exchange Act. Forward-looking statements are not statements of historical fact but rather reflect our current expectations, estimates and predictions about future results and events. These statements may use words such as “anticipate,” “believe,” “estimate,” “expect,” “intend,” “predict,” “project” and similar expressions as they relate to us or our management. When we make forward-looking statements, we are basing them on our management’s beliefs and assumptions, using information currently available to us. These forward-looking statements are subject to risks, uncertainties and assumptions, including but not limited to, risks, uncertainties and assumptions discussed in this annual report. Factors that can cause or contribute to these differences include those described under the heading “Management’s Discussion and Analysis of Financial Condition and Results of Operations.”
If one or more of these or other risks or uncertainties materialize, or if our underlying assumptions prove to be incorrect, actual results may vary materially from what we projected. Any forward-looking statement you read in this annual report reflects our current views with respect to future events and is subject to these and other risks, uncertainties and assumptions relating to our operations, results of operations, growth strategy and liquidity. All subsequent written and oral forward-looking statements attributable to us, or individuals acting on our behalf are expressly qualified in their entirety by this paragraph. You should specifically consider the factors identified in this annual report, which would cause actual results to differ before making an investment decision. We are under no duty to update any of the forward-looking statements after the date of this annual report or to conform these statements to actual results.
| 3 |
Overview
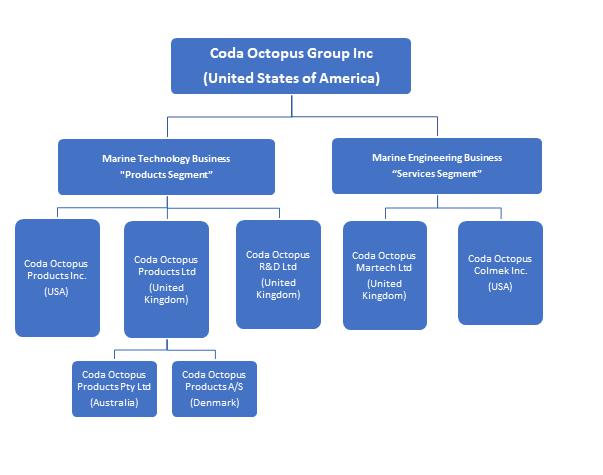
Coda Octopus Group, Inc. (“Coda” “the Company” or “we”), through its wholly owned subsidiaries, operates two distinct businesses:
| ● | the Marine Technology Business (also referred to in this Form 10-K as “Products Business”, “Products Operations” or “Products Segment”); and | |
| ● | the Marine Engineering Business (also referred to in this Form 10-K as “Engineering Business”, “Engineering Operations”, or “Services Segment”). |
Our Marine Technology Business is a technology solution provider to the subsea and underwater market. It owns key proprietary sonar technology used for underwater commercial and defense applications. All design, development and manufacturing of our technology and solutions are performed within the Company. These products and solutions are used primarily in the underwater construction market, offshore wind energy industry (offshore renewables), and offshore oil and gas, complex dredging, port security, mining, fisheries and marine sciences sectors. Our volumetric real time sonar technology is our most promising product for the Group’s growth due to its unique capabilities including real time 3D visualization of moving objects underwater including in zero-visibility water conditions. Our customers include service providers to major oil and gas (“O&G”) companies, renewable companies, underwater construction companies, law enforcement agencies, ports, mining companies, defense bodies, research institutes and universities. We are widely considered the leading solution providers for real time 3D visualization underwater.
Our Marine Engineering Business is a supplier of embedded solutions and sub-assemblies which they design and manufacture and sell into mission critical integrated defense systems such as the Close-In-Weapons System (CIWS). The Services Segment established its business in 1977 and has been supporting a number of significant defense programs for over 40 years, including Raytheon’s CIWS and Northrop Grumman’s Mine Hunting Systems Program. The Services Segment’s business model entails designing sub-assembly prototypes for defense programs which typically lead to contracts for the manufacture, repair and upgrade of these sub-assemblies. We are the sole source for the parts that we supply into these programs. This business model ensures recurring and long tail revenues since we continue to supply parts, typically for the life of the program, which can span decades. Coda Octopus Colmek, Inc. and Coda Octopus Martech Ltd, each qualifies as a small business. This opens up opportunity under state requirements to collaborate with Prime Defense Contractors on these programs.
Due to the above, a significant part of the revenues generated by the Marine Engineering Business is highly concentrated and are derived from a small number of prime defense contractors such as Raytheon or Northrop. In any one year, between 20% to 30% of our consolidated revenues may be derived from these customers either alone or collectively.
The Services Segment operates through our wholly owned subsidiaries, Coda Octopus Colmek, Inc. (“Colmek”) based in Salt Lake City, Utah, and Coda Octopus Martech Limited (“Martech”) based in the United Kingdom.
Our Products and Services operations have established synergies in terms of customers and specialized engineering skills set for robust, rugged and repeated engineering solutions relating to data acquisition, data computation and display of the data. Increasingly drawing on each part of the business strengths, the Marine Technology business and Marine Engineering Business work jointly on projects including responding jointly for tenders.
Our corporate structure is as follows:
Corporate History
The Company began as Coda Technologies Limited. This company now operates under the name Coda Octopus Products Limited, a United Kingdom corporation formed in 1994 as a start-up company with its origins as a research group at Herriot-Watt University, Edinburgh, Scotland. Initially, its operations consisted primarily of developing software for subsea mapping and visualization using sidescan sonar (a technology widely used in commercial offshore geophysical survey and naval mine-hunting to detect objects on, and textures of, the surface of the seabed).
| 4 |
In June 2002, we acquired Octopus Marine Systems Ltd, a UK corporation, and changed our name to Coda Octopus Limited. At the time of its acquisition, Octopus Marine Systems was producing geophysical products broadly similar to those of Coda, but targeted at the less sophisticated, easy-to-use, “work-horse” market. The Octopus Marine Systems acquisition led to the introduction of the Motion product (F180® series) into the Products Segment.
In December 2002, Coda Octopus Ltd acquired OmniTech AS, a Norwegian company, which became a wholly owned subsidiary of the Company and which subsequently changed its name to Coda Octopus R&D AS. OmniTech owned the patents to a “method for producing a 3-D Image” (which has now expired). At the time of acquisition, this company had been engaged for over ten years in developing a revolutionary imaging and visualization sonar technology capable of producing real time three-dimensional (“3D”) underwater images for use in subsea activities. Coda Octopus Products Limited (Edinburgh based) then developed the visualization software to control and display the images from the real time 3D sonar. This patented technology is now marketed by us under the brand name “Echoscope®”. All activities of this now-defunct Norwegian subsidiary have been transferred to Coda Octopus Products Limited (Edinburgh).
On July 13, 2004, the Company effected a reverse merger pursuant to the terms of a share exchange agreement between The Panda Project, Inc. (“Panda”), a Florida corporation, and a now defunct entity affiliated with Coda Octopus Ltd. (“Coda Parent”). Panda acquired the shares of Coda Octopus Limited, a UK corporation and a wholly-owned subsidiary of Coda Parent, in consideration for the issuance of a total of 1,432,143 shares of common stock to Coda Parent and other shareholders of Coda Octopus Limited. The shares issued represented approximately 90.9% of the issued and outstanding shares of Panda. The share exchange was accounted for as a reverse acquisition of Panda by Coda. Subsequently, Panda was reincorporated in Delaware and changed its name to Coda Octopus Group, Inc.
In June 2006, we acquired Coda Octopus Martech Limited which is part of our Services Segment or Marine Engineering Business. This is an English corporation.
In April 2007, we acquired Coda Octopus Colmek, Inc. which is part of our Services Segment or Marine Engineering Business. This is a Utah corporation.
Both Martech and Colmek largely have the same business model, provide similar engineering services and sell to a similar customer base (one is UK focused and the other is US focused).
Coda Octopus Group, Inc., is organized under the laws of the State of Delaware as a holding company that conducts its business through subsidiaries, several of which are organized under the laws of foreign jurisdictions, including England, Scotland, Denmark and Australia. This may have an adverse impact on the ability of U.S. investors to enforce a judgment obtained in U.S. courts against these entities, or to effect service of process on the officers and directors managing the foreign subsidiaries. These companies’ operations must comply with the laws of the countries under which they are incorporated and are likely to be different from the equivalent laws of the United States.
| 5 |
Marine Technology Business (“Products Segment”)
Our Marine Technology Business develops proprietary solutions for both the commercial and defense subsea market. The range of our solutions are complementary and include:
| ● | Geophysical Systems comprising hardware and software; and | |
| ● | Motion and Positioning Systems comprising hardware and software; and | |
| ● | Real Time Volumetric Imaging Sonar comprising hardware and software. |
These products are sold, leased or rented into various marine sectors and include:
| ● | Marine geophysical survey | |
| ● | Underwater construction | |
| ● | Diving | |
| ● | Salvage and decommissioning | |
| ● | Oil and gas | |
| ● | Commercial fisheries | |
| ● | Environmental, mammal and habitat monitoring | |
| ● | Defense | |
| ● | Marine vehicles and robotics | |
| ● | Security, law enforcement and first responders | |
| ● | Research and education |
1. Geophysical Range of Products
Our geophysical systems (“GEO”) range of products include geophysical data acquisition systems, processing and analysis software that are used primarily by survey companies, research institutions, salvage companies and, more recently, offshore energy and renewables operators. These systems are used to survey large areas and create images of the seabed, identify seabed boulders and objects, mark seabed type boundaries and identify existing subsurface structural features, geological layers, and/or buried debris.
2. GPS aided Inertial Positioning Systems
These are referred to as our MOTION range of products and offer high accuracy GPS aided inertial positioning and attitude data, essential for all marine survey applications. The products are commonly bundled with our GEO and real time sonar solutions offering our customers a seamless integration and support experience.
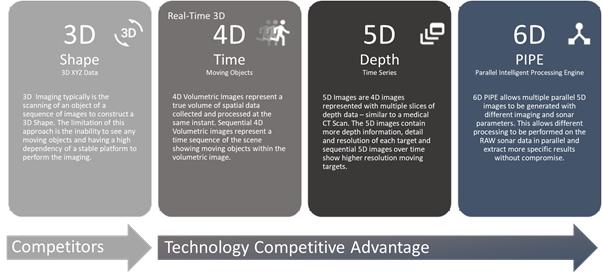
3. Real Time Volumetric Imaging Sonars (ranging from 3D/4D, 5D and 6D)
We design, develop and supply what we believe is the world’s most advanced series of real time volumetric imaging sonar. This is the culmination of over 25 years of research and development. This technology is protected by multiple patents. Furthermore, we continue to file patents relating to our new and revolutionary sonars, our 5-Dimensional (5D) and 6-Dimensional (6D) real time volumetric imaging sonars (marketed under the name Echoscope® PIPE (Parallel Intelligent Processing Engine). Our sonar innovations are multi-tiered and extend to hardware, firmware and software, all of which co-exist and are co-dependent on each other. In other words, hardware, firmware and software operate as sub-systems to each other. We believe that the highly complex nature of this new technology will make it extremely difficult to reverse engineer our products. Pioneering this unique technology gives us a significant advantage over our competitors in the subsea imaging sonar market sectors. We also believe that our three-tier product development capability of hardware, software and solution delivery adds to our competitive lead.
We believe that this technology is superior to the other imaging sonars in the market as it generates real time 3D, 4D, 5D and 6D images of the underwater environment irrespective of low or zero visibility conditions and, unlike conventional sonars, can image a volume (as opposed to a slice of data) and subsea moving objects.
Sonar Hardware
During fiscal 2019, we completed critical innovation and advancement milestones around our core volumetric real time sonar technology. We have now introduced the world’s first 5D and 6D series of volumetric imaging sonar technology. We believe our 5D and 6D series of sonars heralds a significant leap forward in real time subsea imaging as this inventive capability allows a single sonar to provide to different parts of the survey operations multiple real time data sets (as opposed to one 3D dataset) for each part of the survey teams’ requirements.
| 6 |
We believe that our real time volumetric imaging sonar products are revolutionizing the sonar market due to the following unique capabilities:
| A. | Live 3D imaging of any moving objects within the sonar field of view including construction assets, divers, subsea vehicles and tools and machinery executing tasks underwater. |
| B. | Accurate three-dimensional data unaffected by motion or water visibility. |
| C. | Mapping of complex structures with a volumetric ping as opposed to individual angular slices of data. The more complex the structure, the greater the benefit of real-time volumetric sonar imaging over a traditional survey. |
| D. | Live situational awareness of static and moving objects for safe terrain navigation or target tracking. |
| E. | First Person Perspective imaging allowing the operator to point the real-time volumetric imaging sonar towards any target, regardless of where in the water column the target is located and generate a true first person perspective image. |
| F. | Imaging or visualizing subsea environments in low or zero visibility conditions and in situations of high waterflow and active noise pollution (dredging and rock dumping). |
| G. | 3D Range gating of the live image to focus on specific targets or features at specified ranges – regardless of signal strength. This specifically allows for weak targets close to the sonar to be discarded from the image (e.g. bubbles or fish) or detected as threats (e.g. fishing nets). |
| H. | Coherent single sensor delivery for multiple applications. |
| I. | Unique rendering and viewing software techniques that simplifies data interpretation. |
| J. | Direct integration with a range of compatible sensors (e.g. GPS, attitude sensors), actuators (pan and tilt) and custom, task-specific software that provides task or mission solutions for key markets such as the underwater construction market and offshore wind energy sector. |
Prior to January 2018, we were selling our third generation (3G) sonar series. In January 2018 we launched the first product within our fourth generation series of sonars (“4G sonar series”). The 4G sonar series is an important development milestone for the Company. Due to the form factor of our previous generation of 3G sonar series this limited the types of subsea vessels/vehicles this generation of sonar could be integrated on (and therefore be used for) due to (i) size; (ii) weight and (iii) power requirements (“form factor barriers”). With the launch of the 4G sonar series we have removed these form factor barriers and can now integrate on the majority of underwater vehicles in the market including the new and fast emerging smaller underwater vehicles such as autonomous surface vehicles (ASVs) and unmanned underwater vehicles (UUVs) which are propelling growth in the underwater market.
The 4G sonar series developments were largely form factor driven as opposed to being based on performance and capability advancements. In fiscal years 2019 and 2020 we continued our innovation of our sonar technology to focus on performance and capability advancements, particularly on the beamforming and the data processing capability of our sonar series. In the previous generation of our sonars, due to limitations in processing capability technology there were restrictions on how much of the captured sonar data could be processed. Our previous generations of sonars processed 16,384 pieces of data per sonar ping (compared to around 256 pieces of data per sonar ping for competing technology such as the multibeam). Under our new 5D/6D sonars series for each signal that is generated by the sonar we receive back up to 40 million pieces of information which we can now process. We believe that this advancement allows us to deliver to the market the first 5-Dimensional (5D) sonar and 6-Dimensional (6D) sonar capabilities and significantly builds on our 4G sonar series. Our 5D capability allows customers to collect full time series 4D backscatter data in real time. Our 6D capability allows customers to use a single sonar for multiple simultaneous real time data sets using different real time capture and processing parameters (such as range, frequency and field of view).
The 4G sonar series development which we launched in 2018 now combined with the performance and capability advancements (5D and 6D capability) crystalizes the completion of the main pillars of development plans for our real time volumetric sonar series. We believe these achievements are critical milestones in the Company’s growth strategy and also distinguishes our sonar capabilities from all other imaging sonar offerings in the market. This will enable us to refocus a significant part of our spending from R&D to marketing and business development post-Pandemic.
| 7 |
The following diagram outlines the capability summary progression as we transition from our current Real-Time 3D (4D) volumetric imaging sonar system to 5D and then 6D.
Sonar Software
Our software development capability is an important part of our strategy to maintain our lead in designing, manufacturing and selling state-of-the-art real time volumetric imaging sonars.
Our existing third generation (3G) Underwater Survey Explorer software used in conjunction with our real time volumetric sonars, is a product which we have been developing for over 15 years. Because of technological advancements, including access to off the shelf components for more advanced processing of data (speed and size being factors), in 2016, the Company started the process of re-conceiving and developing its top-end software for our now much more advanced sonars. In this connection, in 2019, we launched for customer evaluation our 4th Gen of top-end software for our sonars – 4G Underwater Survey Explorer (“4G USE®”). We have also filed several provisional patents around our 4G USE®.
Our 3G Underwater Survey Explorer software is feature rich and offers advanced processing and application focused capabilities for various markets. 3G USE has been in the market for over 15 years. While this generation of our software is a mature and feature rich product, communication and graphics processing technologies have advanced considerably over recent years, allowing (for example) improved methods for processing larger volumes of data and leveraging new capabilities in recent PC hardware and the GPU.
Our new 4G USE® software is a ground-up development based on the latest processor capabilities and software architecture. 4G USE® will offer a completely new level of real-time visualization and automation processing to complement our recent sonar launches including our 5D and 6D sonars. The initial release of 4G USE® allows multiple devices being utilized simultaneously (example multiple sonars, rotators and inertial and positioning systems) and viewing the real-time data result in a consolidated image. 4G USE® which is also subject to a number of patent applications, is designed as an enterprise class platform, allowing many users access and control of data in real-time for better collaboration, tighter quality control, remote surveying and faster processing.
| 8 |
Our software packages are feature rich and include techniques which are the subject of patents in a number of our modules. In general, our software package contains significant capabilities that are designed to enable surveying a dynamic subsea setting (as opposed to a static mapping of the seabed as is typical for conventional sonar technology). Some of our unique features include:
| Feature Description | Functionality | |
| Real Time Measurements | important for many types of subsea operations such as block or asset placements or aiding diving operations; | |
| Models + Software Module | allows the user to import existing models and engineering drawings into the real time subsea environment; | |
| Edge Detection Algorithm | allows the user to superimpose an edge to easily identify a subsea target; | |
| Rendering a Noise Free Image | allows for a crisp, clear and high-resolution photo-like image without any processing (which would be required for conventional sonars); and | |
| Tracking Algorithm | Algorithm is used to track known objects within the real time 3D Data. This is currently utilized in our Construction Monitoring Software Package (see below) |
Our Echoscope® PIPE (the first 6-Dimensional Sonar) will also bring significant capabilities to include multiple parallel processing (enabling different parameters to be set and utilized) in real time mode. We are not aware of any sonars that can offer this capability. This will allow multiple tasks and users of the real time data simultaneously, thus increasing efficiency and enabling tasks which were previously impossible.
Geophysical Products and Solutions
We started our business in 1994 designing and developing the CodaOctopus® GeoSurvey software and hardware package for acquisition and processing of sidescan sonar and sub-bottom profiler data. For over two decades, our GeoSurvey has been an industry leading software package in the market for data acquisition and interpretation and provides feature rich solutions and productivity enhancing tools for the most exacting survey requirements. Designed specifically for sidescan and sub-bottom data acquisition, CodaOctopus® GeoSurvey has been purchased by numerous leading survey companies throughout the world.
The Products Business generates around 5% of its revenues from this range of products. With the launch of the new products based on Artificial Intelligence technology for which we believe there is increased demand we would anticipate our revenues from this line to increase over time.
Geophysical Hardware
These consist of a range of hardware solutions for field acquisition of sidescan sonar and sub-bottom profiler, which includes analog and digital interfaces compatible with all geophysical survey systems.
In 2018, we introduced our DA4G-USB product. This allows customers to integrate the DA4G hardware into their own PC configuration. Based on the CodaOctopus® DA4G system, it offers the same functionality, robustness and ease of use. CodaOctopus® DA4G is the 4th generation of our successful DA series and is built on twenty years of knowledge, experience and innovation in supplying unparalleled products and service to the worldwide geophysical survey sector. These purpose-built, turn-key, systems incorporate the very latest hardware specifications and are designed and delivered to meet the demanding nature of offshore survey work.
The CodaOctopus® DA4G range consists of a number of options and is backed (like all our products) with global service and support.
This consists of an integrated suite of software that automates the tasks of analyzing, annotating and mosaicing complex data sets, thus ensuring faster and more precise results.
Geophysical Software
Our CodaOctopus® GeoSurvey software is supplied to complement our DA4G hardware, offering field acquisition of sidescan sonar and sub-bottom profiler data.
Our Survey Engine software product offers a more advanced post-processing solution for sidescan sonar and sub-bottom profiler data. Designed to streamline processing of very large data sets – many 100GBs – it offers comprehensive processing, interpretation, visualization, reporting and exporting functionality.
We continue to advance this range of products and in 2018 we launched our first product based on Artificial Intelligence techniques which allows us to automatically identify boulders on the seabed (“Survey Engine Automatic Object Detection (SEADP)”). This new product presents a real opportunity to radically change workflow process for post-processing and analyzing side scan sonar data to assess, among other things, the suitability of an area for exploration and construction activities (O&G installations, pipeline and cable laying activities). This is in its early stage of roll out and has sparked significant interest. This is an area where we are investing our research and development efforts.
| 9 |
Additionally, in 2019 we introduced our Seabed Classification module (again based on Artificial Intelligence techniques). This automatically classifies sidescan sonar imagery into different seabed types, computes and exports polygonal boundaries for these areas, and thereby simplifies sidescan processing.
Inertial Positioning and Attitude Measurement Systems (“Motion Products”)
Our Motion Products are Global Navigational Satellite System (referred to in the industry as “GNSS” Aided Inertial Measurement Units) provide measurement data on the position and attitude of a vessel. This device provides real-time data on these measurements which are applied to compensate for vessel movement in order to align sonar data and remove motion blur.
We have had our F180® series in the market for over 15 years. These systems are used either alone and then paired with third parties multibeam sonars or used in conjunction with our volumetric real time sonars. This technology has been developed for the marine environment and is based on technology originally developed for the extreme world of motor racing. Modifications and enhancements have resulted in a simple-to-use, off-the-shelf product that brings accurate positioning and motion data into extreme offshore conditions for precision marine survey applications worldwide. Variants within the F180® series include the F190, exclusively configured for use ‘near-land’, e.g., within ports and harbors, and the F185, with enhanced precision positioning to 1cm accuracy (<0.5”). Coda Octopus iHeave, an intelligent software product for dealing with long period ocean swell compensation, is fully integrated within the F180® series.
New Generation of Motion Products
We have now completed the ground up development of our new generation of Motion Products (F280®). The new F280 is based on more advanced technology, more accurate than our F180® series. The new technology is much more scalable towards future development of new product variants. The F280® series is highly complementary to our real time volumetric sonar series and they are packaged together to provide a more comprehensive solution to our customers. The F280 is sold with and without our sonar series.
Sales and Marketing
We market our products primarily through our website, industry events, webinars and industry relationships. We also have an internal sales and marketing team which is engaged in marketing and selling our products. In addition, we have a network of non-exclusive independent global sales agents.
Coda Octopus Products Limited has the requisite accreditations for its business including being Lloyds Register accredited to ISO 9001:2015 and Cyber Essentials certification.
| 10 |
Marine Engineering Businesses (“Service Segment”)
Our Marine Engineering Businesses comprise Coda Octopus Colmek, Inc. based in Salt Lake City and Coda Octopus Martech Limited based in the United Kingdom.
These two operating entities supply engineered sub-assembly solutions which form part of mission critical integrated defense systems, test equipment, instrumentation and the like. They operate as sub-contractors to prime defense contractors and their engineering solutions are typically within broader defense programs where high levels of reliability and quality are essential pre-requisites for securing and maintaining these agreements with their customers. Typically, we prototype products for these customers and after going through various acceptance tests, including first article inspection approvals, we are given the production contracts. Many of these production contracts have a repeat orders profile which typically follows the life cycle of the defense program that is using the production part.
These arrangements often give us long term preferred/sole supplier status for the parts we supply, technology refresh and obsolescence management business opportunities with these customers and we generally use these long-standing relationships to win more contracts with these customers.
This business relies on increasing the number of new programs it attracts annually.
In addition, we are increasingly combining our engineering capabilities with our product offerings. This enables us to offer systems which are complete with installation and support to maximize the utilization of our collective expertise to advance our real time volumetric sonar technology.
Coda Octopus Martech Limited (“Martech”)
Martech operates in the specialized niche of bespoke design and manufacturing services mainly to the United Kingdom defense and subsea industries. Its services are provided on a custom sub-contract basis where high quality and high integrity devices are required in small quantities.
The Company enjoys pre-approvals to allow it to be short-listed for certain types of government contracts. Much of the more significant business secured by Martech is through the formal government or government contractor tendering process. Government contracts may be terminated at any time at the discretion of the government. If the government does terminate a contract, the Company is allowed to recover the costs incurred up to the date of termination. During the last few years, only one non-material government contract was terminated for convenience.
| 11 |
Coda Octopus Colmek, Inc. (“Colmek”)
Colmek is a service provider of defense engineering solutions, particularly in the fields of data acquisition, storage, transmission and display. It has grown and diversified since beginning its operations in 1977 and now provides services and products to a wide range of defense, research and exploration organizations in the United States.
It designs, manufactures and supports systems that are reliable and effective in multiple military and commercial applications where ruggedness and reliability under extreme operational conditions are paramount and where lives depend on accurate and precise information.
Colmek has long standing relationships with a number of prime defense contractors and has been supporting a number of defense programs for over 40 years including the Close in Weapons Support Program (CIWS) for which it supplies proprietary parts and services and technical refresh programs. As a result, Colmek has recurring revenues from these long-standing programs. Colmek continues to expand the number of established programs into which it supplies proprietary parts.
In June 2014 Colmek completed the acquisition of the Thermite® which is a rugged visual mission computer line and the Sentiris® AV1 XMC video card for $1,100,000 in cash. Colmek also acquired hardware, Thermite inventory and other intellectual property rights (such as software code and trademarks pertaining to these products). Thermite® was acquired with the goal of updating the technology and expanding the market for this rugged mission computer.
The Thermite® Product fits within established programs with Department of Defense (“DoD”) prime contractors and benefits from being a single source product under this program. Customers for this item include the US Army, Benchmark, and Endeavor Robotics Defense and Security Division.
Thermite ® Rugged Visual Computers
| ● | Rugged, graphics-based PCs designed to perform in the most brutal environmental conditions; | |
| ● | Focus on graphics-based high-performance computing with integrated accelerated video capture capability; | |
| ● | Lightweight, power efficient and conduction-cooled; | |
| ● | Three models optimized for man-wearable, vehicle, and airborne platforms; and | |
| ● | Programs include dismounted soldier training, mission rehearsal, real time imaging, robotic control, weapon system control, sensor processing and display. |
| 12 |
We consider Thermite® to be an important part of our growth strategy and are investing in the new generation of these mission computers and have expended significant development costs on re-engineering this. To this end, we have now designed and developed our next generation of the Thermite® “Octal”. The new Octal is in trials with a number of new customers who fit the profile of large quantity purchasers with repeat and long-term requirements for this product. The coronavirus Pandemic has interrupted the completion of these trials. The Thermite is one of our key growth catalysts.
Other products offered by Colmek include subsea telemetry and data acquisition systems, rugged workstations, analog-to-digital converters and rugged LCD displays.
Competition
In our Products Segment, we are exposed to the following competitive challenges:
Data Acquisition Products (GEO Products)
The sonar equipment industry is fragmented with several companies occupying niche areas, and we face competition from different companies with respect to our different products. In the field of geophysical products, Triton Imaging Inc., a US-based company, now part of the ECA Group (Toulon, France), Chesapeake, a US-based company, and Oceanic Imaging Consultants, Hawaii, USA, dominate the market with an estimated 25% each of world sales, while we believe that we control approximately 5% of world-wide sales.
| 13 |
Inertial Positioning and Attitude Measurement Systems (“Motion Products”)
In the field of motion sensing equipment, where our product addresses a small part of the overall market, we believe that we have four principal competitors: TSS (International) Ltd in Watford, England which is focused on the mid-performance segments with about 25% of the world market; Ixsea, a French company which covers all segments, with about 20% of the market; Kongsberg Seatex, a Norwegian company (part of Kongsberg Gruppen) which has products across all segments, with about 15% of the market; and Applanix, a Canadian company, now part of Trimble which has one major product focused on the high end of the market, with about 20% of the market. We believe that our market share in the field of motion sensing equipment is only about 5%. This market is fiercely competitive and with the advancement of technology, there are new entrants to the market such as SBG Systems (a French based manufacturer of motion sensors). Due to the price pressure in this market, we are selling our products more in conjunction with our real time 3D sonars than on a standalone basis. However, with the development of our new F280®product, this gives us the opportunity to increase our market share.
Real Time Volumetric Sonar
In the field of Real Time 3D/4D/5D imaging, we are unaware of other companies offering a similar product. The entry into this market is dependent upon specialized marine electronics, acoustic and software development skills. The learning curve, which has resulted in the advancement of our real time 3D sonar device, is the culmination of two decades of research and development into this field. Companies such as Tritech International Ltd., United Kingdom, BlueView Technologies Inc., USA (now a part of Teledyne Technologies Incorporated), and Norbit Group AS Norway are examples, but none of these sonar offerings are directly comparable or competitors to our real time volumetric sonar solutions. Specifically, we believe that they do not have the same capabilities as our Echoscope® technology in terms of generating real time 3D, 4D, 5D and 6D images of moving objects underwater including in environments in low or zero visibility conditions. Nor the ability to use a single sonar for multiple real time 3D images simultaneously. Notwithstanding it should be noted that Teledyne has acquired a significant number of substantial subsea companies (examples are Reson and BlueView). Teledyne has much greater resources, liquidity and market reach than our Company and has many operating verticals. We therefore can give no assurance that companies such as these will not enter this market. Notwithstanding, we believe that our recent development and introduction of 5D/6D - Echoscope PIPE®) sonar capability further distinguishes our volumetric sonars and significantly extends our lead over competitors in the subsea imaging market. We are not aware of any other imaging sonars in the market capable of generating real time 5D and 6D imagery underwater. The innovations around Echoscope PIPE® are the subject of numerous patent applications.
We seek to compete on the basis of producing high quality products employing cutting edge technology that is easy to use by operators without specialized skills in sonar technology. We intend to continue our research and development activities to continually improve our products, seek new applications for our existing products, to develop new innovative products and grow the market for our products and expertise.
In our Services Segment, we are exposed to the following competitive challenges:
Marine Engineering Businesses
Through our marine engineering operations, Coda Octopus Colmek, Inc. and Coda Octopus Martech Limited, we are involved in custom engineering for the defense industry in the United States and in the United Kingdom. Martech competes with larger contractors in the defense industry. Typical among these are Ultra Electronics, BAE Systems, and Thales, all of whom are also partners on various projects. In addition, the strongest competitors are often the clients themselves. Because of their size, they often have the option to proceed with a project in-house instead of outsourcing to a sub-contractor like Martech or Colmek.
Intellectual Property
Our product portfolio and technologies are protected by intellectual property rights including trademarks, copyrights and patents. In the last 2 years we have advanced our existing sonar technology and have filed a number of significant patents applications pertaining to these inventions including covering our newly innovated 5D and 6D sonars.
Patents
Our patented inventions along with our strategy to enhance these inventions are at the heart of the Company’s strategy for growth and development.
| 14 |
Our patent portfolio consists of the following:
| Patent Number | Description | Expiration Date | ||
| US Patent No. 7,466,628 | Concerns a “Method of constructing mathematical representations of objects from reflected sonar signals.” | January 1, 2027 | ||
| US Patent No. 7,489,592 | Concerns a “Method of automatically performing a patch test for a sonar system, where data from a plurality of overlapping 3D sonar scans of a surface, as the platform is moved, are used to compensate for biases in mounting the sonar system on the platform”. | July 8, 2027 | ||
| US Patent No. 7,898,902 | Concerns a “method of representation of sonar images” allowing sonar three-dimensional (3D) data to be represented by a two-dimensional image. | June 13, 2028 | ||
| US Patent No. 8,059,486 | Concerns a method of rendering volume representation of sonar images. | April 16, 2028 | ||
| US Patent No. 8,854,920 | Concerns a method of volumetric rendering of three-dimensional sonar data sets | June 22, 2033 | ||
| US Patent No. 9,019,795 | Concerns a method of object tracking using sonar imaging | November 30, 2033 | ||
| US Patent No. 10,088,566 | Concerns a method of object tracking using sonar imaging | November 26, 2036 | ||
| US Patent No. 10,718,865 | Concerns a method of compressing beamforming sonar data | March 1, 2039 | ||
US Patent No. 10,816,652 |
Concerns a method of compressing sonar data |
October 28, 2038 | ||
| JP Patent No. 5565964 | To provide a method for drilling/levelling thereof by an Underwater drilling/levelling work machine construction device | January 31, 2031 | ||
| JP Patent No. 5565957 | To Provide a construction management method by a three- dimensional Sonar by a construction management device | October 31, 2030 |
Trademarks
We own the registered trademarks listed below and they are used in conjunction with the products that we market and sell:
Coda®, Octopus®, CodaOctopus®, CodaOctopus & Design®, Octopus & Design®, F180®, F280®, F280 Series®, Echoscope®, Echoscope 4G®, Echoscope 5D®, 5D Echoscope®, Echoscope 6D®, 6D Echoscope®, Echoscope PIPE® Ping-Pong Echoscope Sonar®, Ping-Pong Echoscope®, Ping-Pong Sonar®, 4G Underwater Survey Explorer®, 4G USE®, Survey Engine®, Dimension®, DAseries®, CodaOctopus® Air, CodaOctopus® Vantage; CodaOctopus® UIS; CodaOctopus® USE, Sentiris® and Thermite®.
In addition, we have registered several internet domain names including www.codaoctopus.com; www.codaoctopusgroup.com; www.colmek.com and www.martechsystems.co.uk.
Research and Development
Research and Development is foundational to our business strategy to ensure our growth strategy and maintain our competitiveness. During the fiscal years ended 2020 and 2019, we spent $3,188,389 and $2,801,331 (a 13.8% increase), respectively, on Research and Development. With the crystallization of our sonar series developments and our F280® inertial navigation system, we would expect R&D expenditures in this area to be less in 2021 fiscal year.
Our products are complex and therefore we can give no assurance that even with spending a significant part of our resources on R&D, we will be successful in our development goals. Furthermore, even following launch of any product we may not succeed. Moreover, we may incur significant research and development expenditures without realizing viable products.
| 15 |
Government Regulation
Because of the nature of some of our products, they may be subject to export control regimes including in the United States, United Kingdom, Denmark and Australia where we conduct business operations. Where our products are subject to such export control requirements, they may only be exported to our customers if there is a valid export license granted by the relevant government body. Moreover, these regulations may change from time to time in these jurisdictions, including the United States, depending on the existing relationship with the country to which the goods are exported. See Item 7 (Management’s Discussion and Analysis of Financial Condition and Results of Operation) for further discussion on this.
We are also required to maintain certain accreditations such as ISO accreditation, cyber security certifications, approvals to hold government items or materials and/or certain personnel or facility clearances.
In addition, as a provider for the US Government, we may be subject to numerous laws and regulations relating to the award, administration and performance of US Government contracts, including the False Claims Act. Non-compliance found by any one agency could result in fines, penalties, debarment, or suspension from receiving additional contracts with all US Government agencies. Given our dependence on US Government business, suspension or debarment could have a material adverse effect on our business and results of operations.
Employees
As of the date hereof, we employ approximately 110 employees worldwide, of which 12 hold management positions. A large majority of our employees have a background in science, technology and engineering, with a substantial part being educated to degree and PhD level. None of our employees are employed under a collective agreement and we have not experienced any organized labor difficulties in the past.
Not required for smaller reporting companies.
ITEM 1B. UNRESOLVED STAFF COMMENTS.
None.
| 16 |
Orlando, Florida
Our corporate offices are co-located with our subsidiary Coda Octopus Products, Inc. in Orlando. We own these business premises comprising 3,000 square feet that includes office space and R&D facilities.
Salt Lake City, Utah, USA
Coda Octopus Colmek operates from its premises which comprises 16,000 square feet and includes production, R&D Facilities and office space. These premises are owned by Coda Octopus Colmek.
Edinburgh, Scotland, UK
Coda Octopus Products Limited (Edinburgh based) operates from its premises comprising 12,070 square feet of internal space and includes production, R&D Facilities and office space. These premises are owned by Coda Octopus Products Limited.
Copenhagen, Denmark
As a mitigation strategy in relation to the UK leaving the European Union membership, thus limiting trade relations with EU member states, we have leased business premises in Copenhagen, Denmark. The lease runs from September 1, 2019 to September 1, 2023 with a clause allowing us to break the lease with effect from September 1, 2021 upon 6 months’ notice.
Annual rent is DKK 131,625 plus Value Added Tax (being an equivalent of $19,660 per annum) with an annual increase of 3%.
Portland, Dorset, UK
Martech uses premises owned by Coda Octopus Products Limited. These premises are located in the Marine Center in Portland, Dorset, United Kingdom, and comprise 9,890 square feet. The building comprises both office space and manufacturing and testing facilities. The lease is on a rent-free basis for a period of 2 years expiring December 31, 2020. After this Martech will resume paying Coda Octopus Products Limited rent amounting to the equivalent of $56,457 per annum.
All non-US Dollar denominated rents are stated according to prevailing exchange rates as of the date of each respective lease agreement.
From time to time, we may become involved in various lawsuits and legal proceedings which arise in the ordinary course of business. However, litigation is subject to inherent uncertainties, and an adverse result in these or other matters may arise from time to time that may harm our business. We are currently not aware of any such legal proceedings that we believe will have, individually or in the aggregate, a material adverse effect on our business, financial condition or operating results.
ITEM 4. MINE SAFETY DISCLOSURES.
Not Applicable.
| 17 |
ITEM 5. MARKET FOR REGISTRANT’S COMMON EQUITY, RELATED STOCKHOLDER MATTERS AND ISSUER PURCHASES OF EQUITY SECURITIES
Our common stock has been traded on the Nasdaq Capital Market under the symbol “CODA” since July 19, 2017. Prior thereto, it had been quoted on the OTCQX since February 8, 2017 under the symbol COGI, and prior thereto, on the OTC Pink Sheets under the symbol CDOC. The following table sets forth the range of high and low bid prices of our common stock as reported and summarized on the Nasdaq, for the periods indicated. These prices are based on inter-dealer bid and asked prices, without markup, markdown, commissions, or adjustments and may not represent actual transactions.
| Year Ended October 31, 2020 | HIGH | LOW | ||||||
| First Quarter | $ | 9.26 | $ | 6.29 | ||||
| Second Quarter | $ | 7.04 | $ | 4.63 | ||||
| Third Quarter | $ | 6.17 | $ | 4.41 | ||||
| Fourth Quarter | $ | 6.73 | $ | 5.42 | ||||
| Year Ended October 31, 2019 | HIGH | LOW | ||||||
| First Quarter | $ | 6.86 | $ | 5.23 | ||||
| Second Quarter | $ | 15.30 | $ | 5.91 | ||||
| Third Quarter | $ | 18.97 | $ | 9.71 | ||||
| Fourth Quarter | $ | 11.66 | $ | 7.16 | ||||
We have not declared or paid any cash dividends on our common stock, and we currently intend to retain future earnings, if any, to finance the expansion of our business, and we do not expect to pay any cash dividends in the foreseeable future. The decision whether to pay cash dividends on our common stock will be made by our board of directors, in their discretion, and will depend on our financial condition, operating results, capital requirements and other factors that the board of directors considers significant.
ITEM 6. SELECTED FINANCIAL DATA
Not applicable.
| 18 |
ITEM 7. MANAGEMENT’S DISCUSSION AND ANALYSIS OF FINANCIAL CONDITION AND RESULTS OPERATIONS
Forward-Looking Statements
The information herein contains forward-looking statements. All statements other than statements of historical fact made herein are forward looking. In particular, the statements herein regarding industry prospects and future results of operations or financial position are forward-looking statements. These forward-looking statements can be identified by the use of words such as “believes,” “estimates,” “could,” “possibly,” “probably,” anticipates,” “projects,” “expects,” “may,” “will,” or “should” or other variations or similar words. No assurances can be given that the future results anticipated by the forward-looking statements will be achieved. Forward-looking statements reflect management’s current expectations and are inherently uncertain. Our actual results may differ significantly from management’s expectations.
The following discussion and analysis should be read in conjunction with our financial statements, included herewith. This discussion should not be construed to imply that the results discussed herein will necessarily continue into the future, or that any conclusion reached herein will necessarily be indicative of actual operating results in the future. Such discussion represents only the best present assessment of our management.
General Overview
We operate two distinct business operations. These are:
| ● | the Marine Technology Business (also referred to in this Form 10-K as “Products Business”, “Products Operations” or “Products Segment”); and | |
| ● | the Marine Engineering Business (also referred to in this Form 10-K as “Engineering Business”, “Engineering Operations”, or “Services Segment”). |
Our Marine Technology Business is a technology solution provider to the subsea and underwater market. It has a long-established pedigree in this market, and it innovates, designs, develops and manufactures proprietary solutions for this market (both for commercial and defense applications) including our range of flagship volumetric real time sonar solutions.
These solutions and products are used primarily in the underwater construction market, offshore oil and gas, offshore wind energy industry, and in the complex dredging, port security, mining and marine sciences sectors. Our customers include service providers to major oil and gas (“O&G”) companies, law enforcement agencies, ports, mining companies, defense bodies, fisheries and research institutes.
Our Marine Engineering Business is a supplier of engineering services and embedded solutions (such as mission computers) to prime defense contractors such as Raytheon and Northrop Grumman. Generally, the items supplied into the defense market are sub-systems in broader mission critical integrated systems and thus requires a high level of reliability, consistency in standards and robustness.
We have long-standing relationships with prime defense contractors, and we use these credentials to secure more business. We support some significant defense programs by supplying and maintaining proprietary parts (or parts for which we are preferred suppliers) through obsolescence management programs. These services provide recurring stream of revenues for our Services segment.
| 19 |
Both the Marine Technology Business and Marine Engineering Business have established synergies in terms of customers and specialized engineering skill sets (hardware, firmware and software) encompassing capturing, computing, processing and displaying data in harsh environments.
Our business is affected by a number of factors including those set out below:
| A. | United Kingdom’s withdrawal from the European Union (“Brexit”) |
The UK was a member of the European Union member states for close to 50 years. This membership enabled the freedom of movement of goods, persons, capital and services between member states. Following a referendum in 2016 where the country voted to leave the EU, the UK withdrew from its membership of the EU on December 31, 2020. This withdrawal removed these rights.
As part of the withdrawal, the UK Government and EU reached an agreement on December 30, 2020 on trade in certain areas. At this stage there is scant analysis available on the details of the trade agreement concluded between the parties. However, from the information available we understand that for the solutions and products we supply to the EU member states, there will be no trade tariffs or quotas (applicable at this stage).
However, the change in the UK EU membership status still adversely impacts our business in a number of important areas:
| ● | We will not be able to recruit workers from the EU member states without getting a work permit. | |
| ● | Our technology requires training to support its effective implementation. Typically for sales and rentals we would mobilize our engineers to train and assist these customers in set up of the equipment. Under the new trade agreement, we will need to obtain the necessary work permits from the EU member state to which we intend to send our engineer. This will be time consuming and costly and the rules for granting such permit will vary from member state to member state. Furthermore, we have no precedent to know if these permits will be granted. | |
| ● | We are now subject to custom procedures for exporting our goods to EU member states. Furthermore, the introduction of border controls, where the infrastructure is not in place to support the expeditious movement of vehicles across border, could result in delays of exports and supply chain delays, which could impact on our ability to manufacture our products and meet customer demand in a timely manner. |
Since there is scant detailed analysis available on the recently concluded trade agreement between the UK and the EU, including preconditions, reservations and exclusions that may be present, the full implications for the Company are, at this stage, not completely clear.
The Company established a company, Coda Octopus Products A/S, in Denmark to maintain a presence in the European Union and to address some of the foreseeable issues. Even with the trade deal in place, this subsidiary is still considered important for the Company.
| 20 |
| B. | Currency Risks: |
The Company’s operations are split between the United States, United Kingdom, Denmark and Australia. A large proportion of our revenues (approximately 47%) and costs are incurred outside of the USA with a significant part (46% of our total revenues) of that in the United Kingdom (“UK”). In addition, a significant part of our assets (both current and fixed) is held in British Pounds by our foreign subsidiaries. Significant currency fluctuations (particularly the British Pound versus the US Dollar) may affect our financial results and the value of our assets. With the conclusion of the trade agreement between the UK and EU, we anticipate that unlike the last 4 years which saw increased volatility between the British Pound and other major currencies, including the US Dollar, it will be more stable.
| C. | Impact of Coronavirus Outbreak (referred to in this Form 10-K as “Coronavirus”, (“Pandemic”) or (“COVID-19”) |
General Impact
The global outbreak of the Coronavirus has resulted in governments throughout the world, implementing measures restricting the freedom of movement of people and curtailment of business activities including business closure to curb the spread of the coronavirus.
Our business started to be impacted in February 2020 when several significant industry events such as trade shows important for the promotion and marketing of our products were cancelled. In addition, several navy projects which had been scheduled for implementation were indefinitely postponed in February 2020. During March 2020, governments introduced “global restrictions of movement” that impacted our ability to conduct much of our income generating business activities. Our financial performance was materially impacted in the second quarter of 2020. In the Third Quarter we saw improvement in market conditions. However, in the Fourth Quarter with the resurgence of the so-called “second wave”, our operations were once again hampered with various degrees of closure of the business or reduction in activities to comply with Government regulations or to perform company-wide COVID-19 tests, all of which resulted in substantial fall in business productivity, the decline of revenues in the Fourth Quarter of our fiscal year along with increased costs of operation associated with our Pandemic response. The Pandemic has affected the industry in which our businesses operate in and has resulted in reduced demand for our goods and services in the 2020 FY resulting in a material fall in our revenues with total operating expenses remaining at the same level thus resulting in a fall in our net earnings in the 2020 FY.
In January 2021, the UK Government imposed the highest level of restrictions limiting business operations. Our UK Business is therefore affected and will largely remain closed for the months of January and February 2021. Since we are a manufacturing company, it is increasingly difficult and not financially viable to institute remote working.
Impact on Revenues and Earnings
Until the business environment normalizes, we are uncertain as to the extent of the impact the coronavirus outbreak will have on our future financial results. In the 2020 FY we have experienced three full quarters of the coronavirus impact and our financial results have been negatively impacted as we are seeing less demand for our goods and services and at the same time increased costs associated with managing the Pandemic response in the Company. Furthermore, the ability to continue to implement projects successfully is impacted by rules requiring staff to quarantine (which can be for many weeks). This is further compounded by the size of our business, where often, key functions are concentrated in a small team of staff members who may all be affected by this issue at the same time.
On the Products Business side, a significant part of our revenues is generated from field customer support work (training, assistance in mobilization of equipment or operating the equipment on behalf of our customers). Coronavirus has caused many of these field projects to be postponed indefinitely – which in turn negatively affects our revenues and financial results. This is evident in our rental income which is down by 51.5% in the 2020 FY over the 2019 FY. We believe that travel will not be normalized for much of 2021 and therefore we believe that we will continue to be impacted by the Pandemic (even with the vaccination program now being implemented).
| 21 |
On the Services Business side, travel is also an important element as many of its engineering projects require customers to attend its premises to conduct Critical Design Reviews (“CDRs”). The Coronavirus outbreak has resulted in travel restrictions due to customers’ policy or quarantine requirements. This in turn has resulted in the delay in many engineering projects, thus negatively impacting our revenues and financial results. This business is also affected by the same business interruptions caused by requirements for staff members to self-isolate and this may be an entire team, affecting our ability to operate the business and perform customer projects. It has also dampened demand for our services as many purchasing decisions have been deferred due to many Government employees’ working from home making it difficult to take these decisions in accordance with their practices.
Government Policies on Coronavirus
Our operations are based in a number of countries, with each country establishing different rules related to coronavirus including rules on restricting business operations, limiting staff travel work and quarantining rules. This has generally resulted in a much less predictable working environment for planning and delivering customer projects and project cost management. Several implications flow from this including:
| ● | Impairment of the business’ productivity | ||
| ● | Project over runs | ||
| ● | Increased operation costs resulting from our Pandemic response | ||
| ● | Increase project costs due to the delay caused by self-isolation rules or business closure or restriction on travel to work | ||
| ● | Higher staff costs due to increased sick pay allowance which varies according to the country where the business operations are located, combined with lower overall productivity. |
Impact on Liquidity, Balance Sheet and Assets
Failure to curb the coronavirus Pandemic in the near future, coupled with a downturn in the global economic outlook, may adversely impact on our availability of our free cashflow, working capital and business prospects. As of October 31, 2020, we had cash and cash equivalents of approximately $15.1 million and for the year then ended we generated approximately $4.4 M of cash from operations. Based on our outstanding obligations including loans and notes payable, their terms and our cash balances we believe we have sufficient working capital to effectively continue our business operations for the foreseeable future.
Products Business Outlook
In the 2020 FY the Products Business revenues fell by 12.6% compared to the previous 2019 FY. This was largely due to the business interruption caused by the coronavirus outbreak and the restrictive measures put in place by various governments to contain the virus.
The coronavirus outbreak started to impact our business at the beginning of the second quarter of the current fiscal year (February 2020). The outbreak has limited the number of offshore projects which are undertaken by our customers. This has resulted in a significant fall in the category of revenues relating to project work (rentals) which fell in the 2020 FY by 49.4% and was $1,361,151 compared to $2,688,570 in the 2019 FY. In addition, we have seen a reduced demand for our products and services, which are attributed to the Pandemic, its impact on spending by our customers and also change in policy of the United Kingdom and USA Government concerning exporting of our products to China. In the current fiscal year, we have had the equivalent of $1,300,000 of orders intended for China refused by the UK Government. This is material for our business.
The Products Business operations are global and much of our income generating activities require us to attend customer sites, often on an offshore vessel. Offshore activities now require more planning to ensure personnel entering the offshore facility are virus-free. The new norm requires personnel to be quarantined for a 14-day period in the country where the job site is located, prior to entering the vessel. This limits available resources for customer projects (as project implementation time is likely to increase by the 14 days arrival quarantine and the additional 14 days upon return to home country). It also increases the costs of executing these projects.
A significant part of the Products Business human capital and resources are based in the UK. The UK Government has introduced a tiered system to manage the coronavirus outbreak in various regions of the UK. In January 2021, the Scottish Government moved to the highest levels of restrictions which introduced a national lockdown for the period of January. This restricts our ability to operate the business and we anticipate that this will adversely affect our revenues.
| 22 |
A substantial part of our revenues is generated by our UK operations. With the UK leaving the European Union, we believe that we will realize less sales from the EU member states countries.
We rely on specialist software development skills. There is an acute shortage of these skills which has resulted in reduced resourcing of these skills in our business and at the same time significantly increased costs associated with securing these skills. This could impact our ability to service and develop our products and/or serve to increase our overall costs, and therefore impact on our financial results.
We rely on sophisticated electronics for our products and we anticipate delay in the supply chain and increase in price. This may affect, among other things, our gross margins and ability to fulfill customer orders in a timely manner along with a resulting decline in revenues.
Services Business Outlook
In the 2020 FY the Services Segment revenues fell by 27.8% compared to FY 2019.
This is due to the impact of the coronavirus outbreak which has resulted in reduce demand for our services. In addition, our engineering projects require customers to attend our sites for Critical Design Reviews (“CDRs”). Due to the policy of many organizations to limit travel to “essential travel only”, many CDRs are postponed and this negatively impacts on the advancement of the engineering projects which will impact revenues. The Services Business is likely to continue to be impacted until the curtailments caused by the coronavirus are removed.
The Services Business is also impacted by the change in the US Administration. This will result in a delay in approving the budget and making the appropriations. In addition, there may be changes in the Government’s Defense Spending priorities which could affect the programs that use our products. This could be further compounded where the new Administration in the Senate is operating on a slim majority – which may result in further delays in the finalization of the Federal Defense Budget.
| D. | Political Landscape/Exporting to China |
We sell our products globally and increasingly to Asia. The recent change in both the US and UK Governments attitude towards trade with China, directly affects the sale of our products to customers based in China. Our real time 3D sonars which are rated above 300 meters along with our inertial navigation and attitude measurement sensors (F280® series) are subject to export control for certain countries, including China.
Recently the US Government Department of Commerce (Bureau of Industry and Security) amended the Export administration Regulations (EAR) to add seventy seven (77) Chinese entities “determined ….to be acting contrary to the national security or foreign policy interests of the united States”. The amended EAR in general states that there is a “presumption of denial” of grant of export licenses to these entities and their affiliates.
The UK Government is generally in step lock with the US Government’s position and recently, refused to grant export licenses for several applications for end users in China for the first time in 25 years of our dealing with the UK Export Control Organization. The curtailment of access to this market due to refusal to issue export licenses is likely to significantly impact our revenues from Asia.
Furthermore, even though our sonars which are rated at 250m or less do not require export licenses for China, the UK Customs are now seizing these items which are destined for China.
In 2020 FY we were unable to meet demand for $1,300,000 of sales order for China, due to refusal by the UK Government to issue export licenses.
The removal of China as a trading partner is likely to have significant negative impact on our revenues and growth strategy. China has one of the largest planned investment programs for offshore renewables, the market which most of our technology is used for in China. After significant business development in China, we had started to see persistent and credible growth for our products in this market. Unless there is a change in this policy, we are likely to see a decline in growth and sales into the Chinese Market. It is estimated that around 50-75 multibeam sonars are sold to China Commercial Market each year (approximately $10 million). It is this market we had started to make significant inroads in to increase our global market share. Unless the Government’s current policy/stance changes and becomes favorable to resumption of trade with China, we are unlikely to realize this potential, imminently.
| 23 |
| E. | Price of Commodities and Supply Chain: |
The price of commodities, in particular oil and gas (“O&G”) has a direct impact on the Products Business. The decline in O&G prices since 2014 with a partial recovery since 2016 has resulted in large scale reductions in capital and operational expenditures and seismic changes in the subsea market. This directly impacts on the Products Business by reducing the quantity of sales and rentals into O&G and related markets. O&G has remained very competitive and customers are increasingly seeking significant discounts to place orders. Around 5% of the Marine Technology Business revenues emanates from this sector. Historically, and prior to the price downturn, the vast majority of our revenues were generated from the O&G sector.
Our technology is based on electronics that are designed and manufactured to our specification exclusively for us. These electronic components are costly. Advancement in technology may make these specialized components or circuits obsolete. Reengineering these key components could result in significant capital expenditure and also may cripple the production of our products since quick replacements cannot be found.
| F. | Government Spending for Defense: |
We are dependent on the timely allocation of funds to defense procurement by governments in the United States and the United Kingdom. A large part of our revenues in the Services Segment derives from government funding in the defense sector. In general, where there is a change of government, spending priorities may change from those priorities of the previous Administration. This may adversely impact on our revenues. Since the US Government is due to change in January 2021, this introduces a number of uncertainties including the new Government’s defense priorities and its ability to find consensus in the Senate on the Defense Budget. There is therefore a high probability that this will have an adverse impact on the order take of the Services Business in the 2021 calendar year.
| G. | Resourcing Levels |
Due to the fact that in relative terms we are a small business, we are hindered in our ability to compete for certain specialized electronic engineering skills as our remuneration package is not as competitive as those offered by bigger companies. This is further compounded by the UK leaving the European Union which now restricts our ability to recruit outside of the UK. We are also currently suffering from acute shortage of software resources which could hamper our ability to support our products and therefore impact on revenues and growth plans.
| 24 |
| H. | Investments: |
We lack the financial resources to advance our flagship technology at the commercially appropriate pace required to capture new markets and increase our sales which could facilitate new entrants to the market. For example, Teledyne Technologies Incorporated, a multi-billion company, has in recent years acquired a number of subsea companies that may speed up their entry into our market.
In relative terms, the Company has limited external sources of capital available, and as such is reliant upon its ability to sell its products and services to provide sufficient working capital for its operations and obligations. Notwithstanding, on or around November 27, 2019 the Company secured a $4 million Revolving Credit Line from HSBC NA, its current bankers which can be used for working capital purposes, including expansion activities as required.
| I. | Technological Advancement: |
A significant part of our growth strategy is predicated on our flagship real time volumetric imaging sonar technology. The technology space is inherently uncertain due to the fast pace of innovations and therefore we can give no assurance that we can maintain our leading position in the real time volumetric imaging sonar market or that innovations in other areas may not surpass our unique capability that we currently supply to the subsea market. An example of new technology entering the subsea market is LIDAR technology. However, unlike our sonar technology, LIDAR technology cannot be employed in zero visibility conditions and cannot generate a volume pulse or image moving objects.
Critical Accounting Policies and Estimates
This discussion and analysis of our financial condition and results of operations is based on our consolidated financial statements that have been prepared in accordance with accounting principles generally accepted in the United States of America (“US GAAP”). The preparation of financial statements in conformity with US GAAP requires our management to make estimates and assumptions that affect the reported values of assets and liabilities and the disclosure of contingent assets and liabilities at the date of the financial statements and the reported levels of revenue and expenses during the reporting period. Actual results could materially differ from those estimates.
Below is a discussion of accounting policies that we consider critical to an understanding of our financial condition and operating results and that may require complex judgment in their application or require estimates about matters which are inherently uncertain. A discussion of our significant accounting policies, including further discussion of the accounting policies described below, can be found in Note 2, “Summary of Accounting Policies” of our Consolidated Financial Statements.
Revenue Recognition
All of our revenues are earned under formal contracts with our customers and are derived from both sales and rental of underwater technologies and equipment for imaging, mapping, defense and survey applications and from the engineering services that we provide. Our contracts do not include the possibility for additional contingent consideration so that our determination of the contract price does not involve having to consider potential variable additional consideration. Our product sales do not include a right of return by the customer.
With regard to our Products Segment, all of our products are sold on a stand-alone basis and those market prices are evidence of the value of the products. To the extent that we also provide services (e.g., installation, training, etc.), those services are either included as part of the product or are subject to written contracts based on the stand-alone value of those services. Revenue from the sale of services is recognized when those services have been provided to the customer and evidence of the provision of those services exist.
For further discussion of our revenue recognition accounting policies, refer to Note 2, paragraph h – “Revenue Recognition” in these financial statements.
| 25 |
Stock based Compensation
We recognize the expense related to the fair value of stock based compensation awards within the consolidated statements of income and comprehensive income. The stock based fair value compensation is determined as of the date of the grant or the date at which the performance of the services is completed (measurement date) and is recognized over the periods in which the related services are rendered.
Income Taxes
The Company accounts for income taxes in accordance with Accounting Standards Codification Topic 740, Income Taxes (ASC 740). Under ASC 740, deferred income tax assets and liabilities are recorded for the income tax effects of differences between the bases of assets and liabilities for financial reporting purposes and their bases for income tax reporting. The Company’s differences arise principally from the use of various accelerated and modified accelerated cost recovery system lives for income tax purposes versus straight line depreciation used for book purposes and from the utilization of net operating loss carry-forwards.
Deferred tax assets and liabilities are the amounts by which the Company’s future income taxes are expected to be impacted by these differences as they reverse. Deferred tax assets are based on differences that are expected to decrease future income taxes as they reverse. Correspondingly, deferred tax liabilities are based on differences that are expected to increase future income taxes as they reverse. Note 7 to the Consolidated Financial Statements discusses the amounts of deferred tax assets and liabilities, and also presents the impact of significant differences between financial reporting income and taxable income.
| 26 |
For income tax purposes, the Company uses the percentage of completion method of recognizing revenues on long-term contracts which is consistent with the Company’s financial reporting under U.S. GAAP.
Goodwill and Intangible Assets
Goodwill and intangible assets consist principally of the excess of cost over the fair value of net assets acquired (i.e. goodwill), customer relationships, non-compete agreements and licenses. Goodwill was allocated to our reporting units based on the original purchase price allocation. Goodwill is not amortized and is evaluated for impairment annually or more often if circumstances indicate impairment may exist. Customer relationships, non-compete agreements, patents and licenses are being amortized on a straight-line basis over periods of 2 to 15 years. The Company amortizes its limited lived goodwill and intangible assets using the straight-line method over their estimated period of benefit. We periodically evaluate the recoverability of goodwill and intangible assets and carefully consider events or circumstances that warrant revised estimates of useful lives or that indicate that impairment exists.
Step 1 of the goodwill impairment test used to identify potential impairment compares the fair value of the reporting unit with its carrying amount, including goodwill. If the fair value, which is based on future cash flows, exceeds the carrying amount, goodwill is not considered impaired. If the carrying amount exceeds the fair value, the second step (Step 2) must be performed to measure the amount of the impairment loss, if any. The Company will early adopt Accounting Standards Codification 2017 – 04, Simplifying the Test for Goodwill Impairment, which permits the Company to impair the difference between carrying amount in excess of the fair value of the reporting unit as the reduction in goodwill. ASC 2017-04 eliminates the requirement in previous GAAP to perform Step 2 of the goodwill impairment test.
At the end of each year, we evaluate goodwill on a separate reporting unit basis to assess recoverability, and impairments, if any, are recognized in earnings. An impairment loss would be recognized in an amount equal to the excess of the carrying amount of the reporting unit compared to the fair value of the reporting unit.
Fiscal Year 2020 Consolidated Results of Operations
For the purpose of this Form 10-K, 2020 FY means the fiscal year ended October 31, 2020 and 2019 FY means the fiscal year ended October 31,2019.
Our consolidated financial results in the 2020 FY were down compared to the 2019 FY. This is due to the ongoing impact of the Pandemic. This has resulted in material business interruptions extending to both our Products and Services operations. This has, amongst other things, resulted in increased project costs related to the cost of our Pandemic response, project delays, a substantial reduction in order in-take and demand for our products and services due to our customers largely being in the same situation.
During 2020 FY, the Marine Technology Business generated 56% of our consolidated revenues compared to 52% in the previous fiscal year and the Marine Engineering Business generated 44% compared to 48% in the previous fiscal year.
Overall, consolidated revenues in the 2020 FY were down over the 2019 FY by 20%; Gross Profit marginally fell from 65.5% to 63.5%; Total Operating Expenses were down by 2.5%; Income from Operations was down by 55.2%; Net Income before Taxes was down by 45.4%. There were no material exceptional costs. A new financial event which occurred in Fiscal Year 2020 is that in the UK, we had payroll grants from the UK Government under its Coronavirus Job Retention Scheme Program (“CJRS” of $257,844 as contribution to UK furloughed UK employees’ salary (as part of the support package for companies during the Pandemic). This is recorded in our accounts as a reduction of payroll (thus, SG&A expenses). In the 2020 FY our companies established in the USA received $648,871 as contribution to US employees’ salary during the Pandemic under the US Government Payroll Protection Program (“PPP”). This amount has now been forgiven under the Program and is recorded in our accounts as “Other Income”.
In the fiscal year 2020, R&D expenditures increased by 13.8% and SG&A expenditures were down 8.6%. We believe that we have realized a large part of our goals for the immediate development of our real time volumetric sonar technology and other products. As such, it is our expectation that the Marine Technology Business will start reducing its R&D expenditures and now focus on its growth strategy thus redirecting resources to marketing and business development.
Diver Augmented Visualization Display (“DAVD”) Progress
In 2018, pursuant to the terms of a Cooperative Research and Development Agreement (“CRADA”) we collaborated in the development of the first-generation prototype Heads Up Display (HUD) Unit for Naval Sea Systems Command (NAVSEA) in conjunction with Naval Surface Warfare Center, Panama Division. The first-generation prototype DAVD was signed off under the CRADA at the end of the calendar year in 2019. This product was approved for sale to the market, including the US Navy and is on the US Approved Navy Use (ANU) list along with certain models of our real time 3D sonar series. We also received an exclusive-license to use the face-plate invention and sell this to the commercial market. We have now started to sell GEN 1 DAVD systems and, also in 2020 we continued the funded development of GEN 2.
Despite the business interruption caused by the Pandemic, we were able to make significant progress in developing the second generation of the DAVD. We have also started to sell DAVD systems to NAVSEA.
| DAVD Units sold in 2020 FY | Approximately $560,000 | |
| DAVD R&D Funding for GEN 2 DAVD for 2020FY recognized as revenues | Approximately $1,000,000 |
A key pillar of our strategy is to increase the sale of our products into the Defense programs which increases funding available for the development and sale of our products.
Comparison of fiscal year ended October 31, 2020 to fiscal year ended October 31, 2019
The information provided below pertains to the Company’s consolidated financial results. For information on the performance of each Segment including the disaggregation of revenues and geographical split, see Note 12 (“Segment Analysis”) of our audited Consolidated Financial Statements of October 31, 2020 and 2019.
| 27 |
Revenue:
| Year Ended October 31, 2020 | Year Ended October 31, 2019 | Percentage Change | ||||||
| $ | 20,043,810 | $ | 25,056,934 | Decrease of 20% | ||||
We realized a significant decrease in revenues in the 2020 FY compared to the 2019 FY. This is due to the impact of the Pandemic on our business which resulted in widespread and persistent business interruption causing downturn in the markets that we operate resulting in lower demand for our products and services. This in turn impacted on our revenue generation.
| Products Business Revenues 2020 FY | $ | 11,278,181 | ||
| Products Business Revenues 2019 FY | $ | 12,908,110 | ||
| Services Business Revenues 2020 FY | $ | 8,765,629 | ||
| Services Business Revenues 2019 FY | $ | 12,148,824 |
The Products Business revenues declined by 12.6% in the 2020 FY over the 2019 FY and the Services Business revenues declined by 27.8% over the said period. Notably, rental revenues generated by the Products Business suffered and declined by 49.4% in the 2020 FY compared to the 2019 FY, where rental revenues were $1,361,151 and $2,688,570, respectively.
A significant part of the revenues recognized in the 2020 FY by both the Products Business and Services Business comprise of orders received prior to the outbreak of the Pandemic. Our order book going into 2021 is significantly weaker than previous fiscal years.
Within our 2020 FY Revenues we have $560,000 recognized for the sale of DAVD systems and approximately $1,000,000 for GEN 2 DAVD R&D developments.
During the 2020 FY, the Company had one customer from whom it generated sales greater than 10% of net revenues. Revenue from this customer was $4,273,702 or 21% of net revenues during the 2020 FY. Total accounts receivable from this customer at October 31, 2020 was $214,747 or 11% of accounts receivable.
Gross Margin:
| Year Ended October 31, 2020 | Year Ended October 31, 2019 | Percentage Change | |||
| 63.5% | 65.5% | Decrease of 2.0 percentage points | |||
| (gross profit of $12,729,448) | (gross profit of $16,429,319) |
Gross Profit Margins reported in our financial results may vary according to several factors. These include:
| ● | The percentage of consolidated sales attributed by Marine Technology Business. The Gross Profit Margin yielded by the Marine Technology Business is generally higher than that of the Services Business; | |||
| ● | The percentage of consolidated sales attributed by the Services Business. The Services Business yields a lower gross profit margin on generated sales which are largely based on time and materials contracts (except for its Thermite® products); | |||
| ● | The mix of sales within the Marine Technology Business including: | |||
| ● | Outright Sale versus Rentals; | |||
| ● | Hardware Sale versus Software; | |||
| ● | Mix of Services rendered in the period – Offshore Engineering Services versus Paid Customer Research and Development Projects; | |||
| The mix of engineering projects performed (Design prototyping versus manufacturing), may also affect Gross Profit Margins; | ||||
| ● | Level of commissions we may give on products due to volume purchase by customer and commissions on sales (both the Services and Marine Technology Businesses work with sales agents). | |||
In the 2020 FY Gross Profit Margins for the Products Operation were 80.0% compared to 80.5% in the 2019 FY. For the Services Operation these were 42.3% in the 2020 FY compared to 49.7% in the 2019 FY. Since there are more variable factors affecting Gross Profit Margins in the Products Business, a table showing a summary break-out of sales generated by the Products Business in the 2020 FY compared to the 2019 FY is set out below:
| 2020 FY Products |
2019 FY Products |
Percentage Change | ||||||||||
| Equipment Sales | $ | 7,183,580 | $ | 6,930,914 | 3.3 | % | ||||||
| Equipment Rentals | 1,361,151 | 2,688,570 | (49.4 | )% | ||||||||
| Software Sales | 453,638 | 604,491 | (24.9 | )% | ||||||||
| Services | 2,279,812 | 2,684,135 | (15.1 | )% | ||||||||
| Total Net Sales | $ | 11,278,181 | $ | 12,908,110 | (12.6 | )% | ||||||
The significant reduction in our rental revenues is due to lower demand caused by the coronavirus Pandemic as customers are pursuing only essential projects. Most customers are still operating essential travel only policy (restricting therefore the number of projects that can be executed). Furthermore, the increase in outright sales means that there is an increase in commission payable which affects our margins. In the mix of our products sales for 2020 FY we have new products which are now being sold, namely, DAVD HUD and Echoscope® C500 companion systems which are sold to the US Navy. Margins on the DAVD HUD and C500 companion systems are less than our margins yielded on our other products since this pricing of the DAVD HUD takes account of volume versus margins. In the event that we are successful with this product (i.e. it is reliable and delivers the functionality required for diving operations), we believe this could be a volume sale product.
For more detailed information on the composition and disaggregation of our revenues, please refer to Note 12 of our audited Consolidated Financial Statements of October 31, 2020 and 2019 (“Segment Analysis” section).
Research and Development (R&D):
| Year Ended October 31, 2020 | Year Ended October 31, 2019 | Percentage Change | ||||||
| $ | 3,188,389 | $ | 2,801,331 | Increase of 13.8% | ||||
We continue to invest in research and development to further our business goals including maintaining our lead in volumetric imaging sonar sector (Products Segment) and becoming an embedded supplier of mission computers through re-engineering our Thermite® (now Thermite® Octal) via our Services Segment and launching derivatives of the newly designed Thermite® Octal. The key unique selling point for the Thermite® range is that we can customize these for specific customer requirements. Competing companies sell standard off the shelf mission computers and, in general, do not offer customize solutions. This is the business opportunity for our Thermite technology.
In the 2020 FY this category of expenditure increased by 13.8%. The increase was largely incurred in the Marine Engineering Business.
In 2020 FY the Products Business continued to develop the range of its product offerings including its volumetric real time imaging sonar series, the new inertial navigation and positioning system (its new F280® series), its new sonar software platform. The Products Business has now crystallized many of these developments and as such R&D expenditures in the Products Operations were down by 11.5% in 2020 FY compared to the 2019 FY.
The Services Operations continued to invest in Thermite® Octal with the goal of providing customizable Thermite® Octal solutions for embedding into a broader range of customer programs and solutions and as such R&D expenditures increased by 613.5% in the 2020 FY for this segment compared to 2019 FY.
Changes in this category by Segment are set out immediately below:
| Description | Amount | % increase / (decrease) | ||||||
| Marine Technology Business (Products Segment) 2020FY | $ | 1,955,364 | (11.47 | )% | ||||
| Marine Technology Business (Products Segment) 2019FY | $ | 2,208,749 | ||||||
| Marine Engineering Business (Services Segment) 2020 FY | $ | 1,042,243 | 613.57 | % | ||||
| Marine Engineering Business (Services Segment) 2019 FY | $ | 146,061 | ||||||
| Coda Octopus Group, Inc. 2020 FY (representing the Head Up Display Costs) | $ | 190,782 | (57.27 | %) | ||||
| Coda Octopus Group, Inc. 2019 FY | $ | 446,521 | ||||||
We believe that we are at the point where we can now manage down R&D expenditures as we have achieved a number of significant development milestones which have required significant expenditures. We will continue to innovate but we believe our 2021 focus, subject to the Pandemic being under control, will be in the area of developing the market for our newly innovated and launched products (such as our 5D/6D sonar series, our F280® and our new 4G USE® software), thus redirecting a significant part of our financial resources into sales and marketing.
Selling, General and Administrative Expenses (SG&A):
| Year Ended October 31, 2020 | Year Ended October 31, 2019 | Percentage Change | ||||||
| $ | 6,737,294 | $ | 7,374,551 | Decrease of 8.6% | ||||
Overall, SG&A in the 2020 FY reduced by 8.6% over the 2019 FY due to certain government relief grants relating to the coronavirus Pandemic coupled with reduction in expenditures in this area. Further discussions on SG&A are set out immediately below:
Key Areas of SG&A Expenditure across the Group for the year ended October 31, 2020 compared to the year ended October 31, 2019
| Expenditure | October 31, 2020 | October 31, 2019 | Percentage Change | |||||||
| Wages and Salaries | $ | 3,194,061 | $ | 3,048,783 | Increase of 4.77% | |||||
| Legal and Professional Fees (including accounting, audit and investment banking services) | $ | 1,004,340 | $ | 1,046,005 | Decrease of 3.98% | |||||
| Rent for our various locations | $ | 55.581 | $ | 85,303 | Decrease of 34.84% | |||||
| Marketing | $ | 92,296 | $ | 173,810 | Decrease of 46.90% | |||||
We incurred a material increase in the category of Wages and Salaries expenditures. In 2020 FY under the UK Government CJRS we had grants for UK employees retained during the Pandemic period of $257,844. Without this contribution under the CJRS this category of expenditures would be $3,451,905 thus representing an increase of 13.2% over the 2019 FY. Additionally, wages and salaries for employees increased to reflect material annual revisions (committed prior to the Pandemic), increase in costs of attracting new software development resources (for which we are experiencing severe competition); increase in Employers’ Pension Contribution (UK) and US 401K plan totaling $124,622 account for the increase in this category of expenditures.
In the 2020 FY expenditures relating to the category of “Rent” reduced by 34.84% compared to FY 2019 as most premises which we now use for our business operations are owned by the Company with the exception of premises used in Denmark and other small storage facilities that we use.
In 2020 FY expenditures relating to the category of “Marketing” reduced by 46.90% due to reduction in travel and trade show costs as a result of the coronavirus Pandemic which restricted movement. We also suffered losses resulting from non-cancellation fees of approximately $40,000, again due to events being cancelled.
In the 2020 FY we had expenses of $610,780 for stock based compensation (a non-cash item) as compared to $650,409 in the corresponding 2019 FY.
| 28 |
Operating Income:
| Year Ended October 31, 2020 | Year Ended October 31, 2019 | Percentage Change | ||||||
| $ | 2,803,765 | $ | 6,253,437 | Decrease of 55.2% | ||||
Operating Income in the 2020 FY compared to the 2019 FY was significantly down due to the impact of the coronavirus on our operations which have been curtailed due to Government restrictions in the countries we operate, reduction in demand for our products resulting from this and increased expenditures relating to our Pandemic response and general increase in costs of our projects due the Pandemic.
Interest Expense:
| Year Ended October 31, 2020 | Year Ended October 31, 2019 | Percentage Change | ||||||
| $ | 70,203 | $ | 91,096 | Decrease of 22.9% | ||||
The reduction in Interest Expense is a reflection of the reduction in the principal amount outstanding under our Senior Secured Debenture with HSBC NA.
Other Income:
| Year Ended October 31, 2020 | Year Ended October 31, 2019 | Percentage Change | ||||||
| $ | 668,245 | $ | 70,212 | Increase of 851.8% | ||||
In 2020 FY, we received $648,871 under the Paycheck Protection Program scheme (“PPP”) which the US Administration made available as part of the Pandemic response package for companies. All the PPP amounts received have been utilized in accordance with the purpose and objective of the program and these amounts have now been forgiven under the Program.
Additionally, the composition of this category includes UK Value Added Tax rebates from purchases made outside of the European Union by our UK operations and is subject to fluctuations based upon the amount of those purchases.
Net Income before Income taxes for the year ended October 31, 2020 compared to the year ended October 31, 2019
| Year Ended October 31, 2020 | Year Ended October 31, 2019 | Percentage Change | ||||||
| $ | 3,401,807 | $ | 6,232,553 | Decrease of 45.5% | ||||
In the 2020 FY, Net Income before taxes was down by 45.5% due to the significant reduction in revenues (by 20% over the previous 2019 FY) which was compounded by “Total Operating Expense’s remaining broadly the same as 2019 FY (a slight reduction of 2.5% in 2020 FY). This resulted in a material decline in Net Income before taxes of 45.5% in the 2020 FY as compared to the 2019 FY.
Net Income after Income taxes for the year ended October 31, 2020 compared to the year ended October 31, 2019
| Year Ended October 31, 2020 | Year Ended October 31, 2019 | Percentage Change | ||||||
| $ | 3,343,585 | $ | 5,225,199 | Decrease of 36.0% | ||||
In the 2020 FY Net Income after Income taxes declined by 36.0% due to the reasons explained in the preceding paragraphs.
Comprehensive Income for the year ended October 31, 2020 compared to the year ended October 31, 2019
| Year Ended October 31, 2020 | Year Ended October 31, 2019 | Percentage Change | ||||||
| $ | 3,157,715 | $ | 5,318,454 | Decrease of 40.6% | ||||
We conduct a large part of our business in various foreign currencies, for example, the British pound, Danish Kroner, Euros and Australian Dollars.
This category is affected by foreign currency adjustments during the reporting period. In the 2020 FY we had a loss of $185,870 compared to a gain of $93,255 in the 2019 FY. There are generally significant foreign currency fluctuations, particularly between the US dollar (our reporting currency) and the British Pound. Since the UK decided to leave the European Union the British Pound has been falling significantly against the US dollar (see Note 2, paragraph n of Notes to the audited Consolidated Financial Statements for October 31, 2020 and 2019 for fuller information regarding our Foreign Currency Translation policy). See also Item 7 (Management Discussions and Analysis of Financial Conditions and Results of Operations), where we discuss “Currency Risks”.
Segment Analysis
We are operating in two reportable segments, which are managed separately based upon fundamental differences in their operations. Segment operating income is total segment revenue reduced by operating expenses identifiable with the business segment. Overhead includes general corporate administrative costs.
| 29 |
The Company evaluates performance and allocates resources based upon operating income. The accounting policies of the reportable segments are the same as those described in the summary of accounting policies.
There are inter-segment sales in the table below which have been eliminated from our financial statements. However, for the purpose of segment reporting, these inter-segment sales are included in the table below only.
The following tables summarize certain balance sheet and statement of operations information by reportable segment for the financial years ending October 31, 2020 and 2019, respectively.
Coda Octopus Martech and Coda Octopus Colmek (“Services Segment” or “Marine Engineering Business”) are providing engineering services as sub-contractors mainly to prime defense contractors and Coda Octopus Products operations are comprised primarily of product sales, technology solutions sales, rental of equipment and/or software and associated services (“Products Segment” or “Marine Technology Business”).
The Company’s reportable business segments sell their goods and services in four geographic locations:
| ● | Americas |
| ● | Europe |
| ● | Australia/Asia |
| ● | Middle East/Africa |
30
| Marine Technology Business (Products) | Marine Engineering Business (Services) | Overhead | Total | |||||||||||||
| Year Ended October 31, 2020 | ||||||||||||||||
| Revenues from External Customers | $ | 11,278,181 | $ | 8,765,629 | $ | - | $ | 20,043,810 | ||||||||
| Cost of Revenues | 2,254,008 | 5,060,354 | - | 7,314,362 | ||||||||||||
| Gross Profit | 9,024,173 | 3,705,275 | - | 12,729,448 | ||||||||||||
| Research & Development | 1,955,364 | 1,042,243 | 190,782 | 3,188,389 | ||||||||||||
| Selling, General & Administrative | 2,779,662 | 2,260,849 | 1,696,783 | 6,737,294 | ||||||||||||
| Total Operating Expenses | 4,735,026 | 3,303,092 | 1,887,565 | 9,925,683 | ||||||||||||
| Income (Loss) from Operations | 4,289,147 | 402,183 | (1,887,565 | ) | 2,803,765 | |||||||||||
| Other Income (Expense) | ||||||||||||||||
| Other Income | 19,184 | 190 | - | 19,374 | ||||||||||||
| Funding from Paycheck Protection Program | 122,327 |
526,544 |
- | 648,871 |
||||||||||||
| Interest (Expense) | (10,612 | ) | (15,672 | ) | (43,919 | ) | (70,203 | ) | ||||||||
| Total Other Income (Expense) | 130,899 | 511,062 | (43,919 | ) | 598,042 | |||||||||||
| Net Income (Loss) before Income Taxes | 4,420,046 | 913,245 | (1,931,484 | ) | 3,401,807 | |||||||||||
| Income Tax Benefit (Expense) | ||||||||||||||||
| Current Tax Benefit (Expense) | 63,590 | - | (12,927 | ) | 50,663 | |||||||||||
| Deferred Tax (Expense) Benefit | (196,664 | ) | 273,666 | (185,887 | ) | (108,885 | ) | |||||||||
| Total Income Tax (Expense) Benefit | (133,074 | ) | 273,666 | (198,814 | ) | (58,222 | ) | |||||||||
| Net Income (Loss) | $ | 4,286,972 | $ | 1,186,911 | $ | (2,130,298 | ) | $ | 3,343,585 | |||||||
| Supplemental Disclosures | ||||||||||||||||
| Total Assets | $ | 22,200,123 | $ | 14,347,827 | $ | 1,491,201 | $ | 38,039,151 | ||||||||
| Total Liabilities | $ | 1,572,314 | $ | 1,321,011 | $ | 749,558 | $ | 3,642,883 | ||||||||
| Revenues from Intercompany Sales - eliminated from sales above | $ | 997,150 | $ | 354,373 | $ | 2,700,000 | $ | 4,051,523 | ||||||||
| Depreciation and Amortization | $ | 678,449 | $ | 105,775 | $ | 22,462 | $ | 806,686 | ||||||||
| Purchases of Long-lived Assets | $ | 811,352 | $ | 19,660 | $ | 167,323 | $ | 998,335 | ||||||||
31
| Marine Technology Business (Products) | Marine Engineering Business (Services) | Overhead | Total | |||||||||||||
| Year Ended October 31, 2019 | ||||||||||||||||
| Revenues from External Customers | $ | 12,908,110 | $ | 12,148,824 | $ | - | $ | 25,056,934 | ||||||||
| Cost of Revenues | 2,519,768 | 6,107,847 | - | 8,627,615 | ||||||||||||
| Gross Profit | 10,388,342 | 6,040,977 | - | 16,429,319 | ||||||||||||
| Research & Development | 2,208,749 | 146,061 | 446,521 | 2,801,331 | ||||||||||||
| Selling, General & Administrative | 3,080,134 | 2,492,410 | 1,802,007 | 7,374,551 | ||||||||||||
| Total Operating Expenses | 5,288,883 | 2,638,471 | 2,248,528 | 10,175,882 | ||||||||||||
| Income (Loss) from Operations | 5,099,459 | 3,402,506 | (2,248,528 | ) | 6,253,437 | |||||||||||
| Other Income (Expense) | ||||||||||||||||
| Other Income | 70,186 | 26 | - | 70,212 | ||||||||||||
| Interest Expense | (10,564 | ) | (14,820 | ) | (65,712 | ) | (91,096 | ) | ||||||||
| Total Other Income (Expense) | 59,622 | (14,794 | ) | (65,712 | ) | (20,884 | ) | |||||||||
| Net Income (Loss) before Income Taxes | 5,159,081 | 3,387,712 | (2,314,240 | ) | 6,232,553 | |||||||||||
| Current Tax Benefit | (9,391 | ) | 33,454 | 15,359 | 39,422 | |||||||||||
| Deferred Tax (Expense) | (336,101 | ) | (496,318 | ) | (214,357 | ) | (1,046,776 | ) | ||||||||
| Total Income Tax Expense | (345,492 | ) | (462,864 | ) | (198,998 | ) | (1,007,354 | ) | ||||||||
| Net Income (Loss) | $ | 4,813,589 | $ | 2,924,848 | $ | (2,513,238 | ) | $ | 5,225,199 | |||||||
| Supplemental Disclosures | ||||||||||||||||
| Total Assets | $ | 19,386,652 | $ | 14,165,120 | $ | 959,472 | $ | 34,511,244 | ||||||||
| Total Liabilities | $ | 1,753,823 | $ | 962,641 | $ | 1,167,007 | $ | 3,883,471 | ||||||||
| Revenues from Intercompany Sales - eliminated from sales above | $ | 1,590,548 | $ | 145,150 | $ | 2,700,000 | $ | 4,435,698 | ||||||||
| Depreciation and Amortization | $ | 581,942 | $ | 236,092 | $ | 15,741 | $ | 833,775 | ||||||||
| Purchases of Long-lived Assets | $ | 2,183,009 | $ | 81,446 | $ | 37,180 | $ | 2,301,635 | ||||||||
32
Liquidity and Capital Resources
At October 31, 2020, the Company had an accumulated deficit of $23,425,622, working capital of $24,301,375 and stockholders’ equity of $34,396,268. For the year then ended, the Company generated cash flow from operations of $4,434,406.
We believe that our current level of cash and cash generation will be sufficient to meet our short and medium-term liquidity needs. At October 31, 2020, we had cash on hand of approximately $15.1 million and both billed and unbilled receivables of approximately $2.9 million. Our current cash balance represents approximately 26 months of Selling, General and Administrative Expenses. The Company continues to critically evaluate the level of expenses that we incur and reduce those expenses as appropriate.
We also have access to a revolving line of credit of $4 million from HSBC NA. This line of credit is available to the Company for short-term working capital purpose. All amounts under the Revolving Line of Credit are payable at the end of each financial year. The facility was renewed for another year and extends to November 2021. To date, the Company has not borrowed any funds under this credit line.
Our main liquidity issues are forward buying components and inventory for our products which encompass specialized electronics, funding our research and development program (“R&D”) which requires significant expenditures in attracting engineering skills and incurring non-recoverable costs for researching, developing and prototyping products and managing our currency exposure.
Operating Activities
Net cash generated from operating activities for the year ended October 31, 2020 was $4,434,406. We recorded net income for the period of $3,343,585. Other items in uses and sources of funds from operations included non-cash charges related to depreciation and amortization, deferred tax asset and stock-based compensation, which collectively totaled $1,487,248. Funding from the Paycheck Protection Program was recognized as income and reduced cash from operating activities by $648,871. Changes in operating assets increased net cash from operating activities by $6,566 and changes in current liabilities increased net cash from operating activities by $245,878.
| 33 |
Investing Activities
Net cash used in investing activities for the year ended October 31, 2020 was $998,335.
Financing Activities
Net cash provided in financing activities for the year ended October 31, 2020 was $162,405 as a result of paying down the debt of the Company and receiving funding from the Paycheck Protection Program.
Secured Promissory Note
On April 28, 2017, Coda Octopus Group, Inc. (the “Company”) together with its wholly owned US subsidiaries, Coda Octopus Products, Inc. and Coda Octopus Colmek, Inc. (together, the “Subsidiaries”), entered into a loan agreement with HSBC Bank NA (the “Lender”) for a loan in the principal amount of $8,000,000 (the “Loan”). The annual interest rate is fixed at 4.56%.
The obligations in connection with the repayment of the Loan are secured by all assets of the Company and its Subsidiaries. In addition, the repayment of the Loan is guaranteed by three of the Company’s overseas subsidiaries.
In March 2018, the Company repaid a significant portion of the outstanding HSBC Debenture. As of October 31, 2020, we had $573,108 outstanding under this Debenture. We anticipate that in accordance with our current repayment schedule the remaining balance will be repaid by the end of the Financial Year 2021.
Foreign Currency
The Company maintains its books in local currency: US Dollars for its US operations, British Pounds for its United Kingdom operations, Danish Kroner for its Danish operations and Australian Dollars for its Australian operations.
For the 2020 FY, 44% of the Company’s operations were conducted inside the United States and 56% outside the United States through its wholly owned subsidiaries. As a result, currency fluctuations may significantly affect the Company’s sales, profitability, balance sheet valuations and financial position when the foreign currencies of its international operations are translated into U.S. dollars for financial reporting purposes. In addition, we are also subject to currency fluctuation risks with respect to certain foreign currency denominated receivables and payables. Although the Company cannot predict the extent to which currency fluctuations may affect the Company’s business and financial position, there is a risk that such fluctuations will have an adverse impact on the Company’s sales, profits, balance sheet valuations and financial position. Because differing portions of our revenues and costs are denominated in foreign currency, movements in those currencies could impact our margins by, for example, decreasing our foreign revenues when the dollar strengthens and not correspondingly decreasing our expenses. The Company does not currently hedge its currency exposure. In the future, we may engage in hedging transactions to mitigate foreign exchange risk.
| 34 |
The translation of the Company’s UK operations’ British Pound denominated balance sheets and results of operations into US dollars was affected by changes in the average value of the US dollar against the British Pound. The average exchange rate during the 2020 FY was $1.2897 USD to the GBP against $1.275 USD to the GBP during the 2019 period – an increase of the value of the GBP against the USD of 1.2%.
The translation of the Company’s Australian operations’ Australian Dollar denominated balance sheets and results of operations into US dollars was affected by changes in the average value of the US dollar against the Australian Dollar. The average exchange rate during the 2020 FY was $0.6830 against $0.7007 USD to the AUD during the 2019 period – a decline of the value of the AUD against the USD of 2.5%.
The translation of the Company’s Danish operations’ Danish Kroner denominated balance sheets and results of operations into US dollars was affected by changes in the average value of the US dollar against the Danish Krone. The average exchange rate during the 2020 FY was $0.1517 against $0.1505 USD to the DKK during the 2019 period – an increase of the value of the DKK against the USD of 0.8%.
These are the values that have been used in the calculations below.
The impact of these currency fluctuations on the 2020 FY is shown below:
| British Pounds | Australian Dollar | Danish Kroner | US Dollar | |||||||||||||||||||||||||||||||||
| Actual | Constant | Actual | Constant | Actual | Constant | Actual | Constant | Total | ||||||||||||||||||||||||||||
| Results | Rates | Results | Rates | Results | Rates | Results | Rates | Effect | ||||||||||||||||||||||||||||
| Revenues | 10,056,033 | 9,938,260 | 230,565 | 236,534 | - | - | 10,286,598 | 10,174,794 | 111,804 | |||||||||||||||||||||||||||
| Costs | 3,868,545 | 3,823,238 | 9,456 | 9,701 | - | - | 3,878,001 | 3,832,939 | 45,062 | |||||||||||||||||||||||||||
| Net profit (losses) | 6,187,488 | 6,135,022 | 221,109 | 226,833 | - | - | 6,408,597 | 6,341,855 | 66,742 | |||||||||||||||||||||||||||
| Assets | 18,257,597 | 17,910,603 | 968,808 | 997,170 | 24,243 | 24,421 | 19,250,648 | 18,932,194 | 318,454 | |||||||||||||||||||||||||||
| Liabilities | (1,800,549 | ) | (1,766,326 | ) | 16 | 16 | 3,335 | 3,359 | (1,797,198 | ) | (1,762,953 | ) | (34,245 | ) | ||||||||||||||||||||||
| Net assets | 16,457,048 | 16,144,275 | 968,824 | 997,186 | 27,578 | 27,780 | 17,453,450 | 17,169,241 | 284,209 | |||||||||||||||||||||||||||
This table shows that the effect of constant exchange rates, versus the actual exchange rate fluctuations, increased net income for the year by $66,742 and increased net assets by $318,454. These amounts are material to our overall financial results.
Since the UK voted to leave the European Union membership in 2016 until recently, the UK’s future trade relationship with the European Union was uncertain. This uncertainty gave rise to significant volatility of the UK Pound against major currencies including the US Dollar causing us to suffer losses due to currency fluctuations. With the future relationship now determined, it is anticipated that the fluctuations between the British Pound and other major currencies including the US Dollar will not be as extreme and we anticipate that losses suffered due to this is likely to reduce.
Off-Balance Sheet Arrangements
We do not have any off-balance sheet arrangements.
Inflation
The effect of inflation on the Company’s operating results was not significant during the 2020 period.
| 35 |
ITEM 8. FINANCIAL STATEMENTS AND SUPPLEMENTARY DATA
Reference is made to the Index of Financial statements following Part III of this Report for a listing of the Company’s Consolidated Financial Statements and Notes thereto.
ITEM 9. CHANGES IN AND DISAGREEMENTS WITH ACCOUNTANTS ON ACCOUNTING AND FINANCIAL DISCLOSURE
None.
ITEM 9A. CONTROLS AND PROCEDURES
Evaluation of Disclosure Controls and Procedures
Disclosure controls and procedures are controls and other procedures that are designed to ensure that information required to be disclosed by us in the reports that we file or submit under the Securities Exchange Act of 1934, as amended (the “Exchange Act”) is recorded, processed, summarized and reported, within the time periods specified in the Securities and Exchange Commission’s (the “SEC”) rules and forms. Disclosure controls and procedures include, without limitation, controls and procedures designed to ensure that information required to be disclosed by us in the reports that we file under the Exchange Act is accumulated and communicated to our management, including our principal executive and financial officers, as appropriate to allow timely decisions regarding required disclosure.
The Company’s management, under the supervision and with the participation of the Company’s Chief Executive Officer and Chief Financial (and principal accounting) Officer, carried out an evaluation of the effectiveness of the design and operation of the Company’s disclosure controls and procedures (as defined in Rule 13a-15(e) and 15d-15(e) of the Exchange Act) as of October 31, 2020. Based upon that evaluation the Chief Executive Officer and Chief Financial Officer concluded that the Company’s disclosure controls and procedures were effective as of the end of the period covered by this report.
Management’s Report on Internal Control over Financial Reporting
A company’s internal control over financial reporting is a process designed by, or under the supervision of, a public company’s principal executive and principal financial officers, or persons performing similar functions, and effected by the board of directors, management and other personnel, to provide reasonable assurance regarding the reliability of financial reporting and the preparation of financial statements for external purposes in accordance with US generally accepted accounting principles (“US GAAP”) including those policies and procedures that: (i) pertain to the maintenance of records that in reasonable detail accurately and fairly reflect the transactions and dispositions of the assets of the company, (ii) provide reasonable assurance that transactions are recorded as necessary to permit preparation of financial statements in accordance with US GAAP, and that receipts and expenditures are being made only in accordance with authorizations of management and directors of the company, and (iii) provide reasonable assurance regarding prevention or timely detection of unauthorized acquisition, use or disposition of the company’s assets that could have a material effect on the financial statements.
Management is responsible for establishing and maintaining adequate internal control over financial reporting. Our management, with the participation of our Chief Executive Officer and Group Financial Officer, has assessed the effectiveness of our internal control over financial reporting as of October 31, 2020. In making this assessment, our management used the criteria established in Internal Control—Integrated Framework issued by the Committee of Sponsoring Organizations of the Treadway Commission (COSO 2013 Framework). Based on its assessment, our management believes that, as of October 31, 2020 our internal control over financial reporting was effective based on those criteria.
This annual report does not include an attestation report of the Company’s independent registered public accounting firm regarding internal control over financial reporting. Management’s report was not subject to attestation by the Company’s independent registered public accounting firm pursuant to rules of the SEC that permit the Company to provide only management’s report in this annual report.
Changes in Internal Control over Financial Reporting
During the year ended October 31, 2020, there were no changes in the Company’s internal control over financial reporting (as defined in Rule 13a-15(f) and 15d–15(f) under the Exchange Act) that have materially affected, or are reasonably likely to materially affect, the Company’s internal control over financial reporting.
Not Applicable
| 36 |
ITEM 10. DIRECTORS, EXECUTIVE OFFICERS, AND CORPORATE GOVERNANCE
Directors and Executive Officers
The following persons are the executive officers and directors as of the date hereof:
| Name | Age | Position | ||
| Annmarie Gayle | 55 | Chief Executive Officer and Chairman | ||
| Michael Midgley | 68 | Chief Financial Officer, Chief Executive Officer of Coda Octopus Colmek, Inc. | ||
| Blair Cunningham | 51 | President of Technology | ||
| Michael Hamilton | 73 | Director | ||
| Captain Charlie Plumb | 78 | Director | ||
| Mary Losty | 60 | Director | ||
| Tyler G. Runnels | 64 | Director |
Annmarie Gayle has been our Chief Executive Officer and a member of the Board of Directors since 2011 and our Chairman since March 2017. She is also our Chief Executive Officer for our flagship products business, Coda Octopus Products, Limited (UK) since 2013. Prior thereto, she spent two years assisting with the restructuring of our Company. She previously served with the Company as Senior Vice President of Legal Affairs between 2006 and 2007. Earlier in her career she worked for a leading London law practice specializing in Intellectual Property Rights, the United Nations and the European Union. Ms. Gayle has a strong background in restructuring and has spent more than 12 years in a number of countries where she has been the lead adviser to a number of transitional administrations on privatizing banks and reforming state-owned assets in the Central Eastern European countries including banking, infrastructure, mining and telecommunications assets. Ms. Gayle has also managed a number of large European Union funded projects. Ms. Gayle holds a Law degree gained at the University of London and a Masters of Law degree in International Commercial Law from Cambridge University and has completed her professional law exams to practice law in England & Wales. Because of her wealth of experience in corporate governance, large scale project management, restructuring, strategy, structuring and managing corporate transactions, we believe that she is highly qualified to act as our Chief Executive Officer.
Michael Midgley has been our Chief Financial Officer since December 2017 and our acting Chief Financial Officer since 2013. He has also been Chief Executive Officer of Colmek since 2010, which he joined in 2008. He is a qualified CPA and has had his own practice as well as working for regional accounting firms, specializing in SEC and Tax practice areas. Mr. Midgley attended the University of Utah where he obtained a BA in Accounting. Due to Mr. Midgley’s expertise in financial reporting, we believe that he is highly qualified to serve as the Company’s Chief Financial Officer.
Blair Cunningham has been with the Company since July 2004 and has had a number of roles including President of Technology and CEO of Coda Octopus Products, Inc. (current positions), Chief Technology Officer since 2005 and Technical Manager of Coda Octopus Products Ltd between July 2004 and July 2005. Mr. Cunningham received an HND in Computer Science in 1989 from Moray College of Further Education, Elgin, Scotland. Because of Mr. Cunningham’s expertise in technology, systems software development and project management, the Company believes that he is highly qualified to serve in his current roles.
Michael Hamilton was our Chairman of the Board between June 2010 and March 2017. He is currently serving as an independent director of our Board. Since 2014, Mr. Hamilton has provided accounting and valuation services for a varied list of clients. He was Senior Vice President of Powerlink Transmission Company from 2011 through 2014. From 1988 to 2003, he was an audit partner at PricewaterhouseCoopers. He holds a Bachelor of Science in Accounting from St. Frances College and is a certified public accountant and is accredited in business valuation. Because of Mr. Hamilton’s background in auditing, strategic corporate finance solutions, financial management and financial reporting, we believe that he is highly qualified to be a member of our Board of Directors.
G. Tyler Runnels was elected as a director at the 2018 annual meeting to fill a vacancy. Mr. Runnels has nearly 30 years of investment banking experience including debt and equity financings, private placements, mergers and acquisitions, initial public offerings, bridge financings, and financial restructurings. Since 2003 Mr. Runnels has been the Chairman and Chief Executive Officer of T.R. Winston & Company, LLC, an investment bank and member of FINRA, where he began working in 1990. Mr. Runnels was an early stage investor in our company and T.R. Winston & Company, LLC has served as our exclusive placement agent in one of our private placements raising early rounds of capital for our company. Mr. Runnels has successfully completed and advised on numerous transactions for clients in a variety of industries, including healthcare, oil and gas, business services, manufacturing, and technology. Mr. Runnels is also responsible for working with high net worth clients seeking to diversify their portfolios to include real estate products through established relationships with real estate brokers, accountants, attorneys, qualified intermediaries and financial advisors. Prior to joining T.R. Winston & Co., LLC, Mr. Runnels held the position of Senior Vice President of Corporate Finance for H.J. Meyers & Company, a regional investment bank. Mr. Runnels received a B.S. and MBA from Pepperdine University. Mr. Runnels holds FINRA Series 7, 24, 55, 63 and 79 licenses.
| 37 |
Captain J. Charles Plumb has been a member of Coda’s Board of Directors since September 2019. Captain Plumb is a retired U.S. Navy fighter pilot. On his 75th combat mission, just five days before the end of his tour in Vietnam, he was shot down over Hanoi, taken prisoner and tortured. During his nearly six years as a prisoner of war, he distinguished himself as a pro in underground communications. He was a great inspiration to all the other POWs and served as chaplain for two years. Following his repatriation, Captain Plumb continued his Navy flying career in Reserve Squadrons where he flew A-4 Sky Hawks, A-7 Corsairs and FA-18 Hornets. His last two commands as a Naval Reservist were on the Aircraft Carrier Corral Sea and at Fighter Air Wing in California. He retired from the United States Navy after 28 years of service. His military honors include two Purple Hearts, the Legion of Merit, the Silver Star, the Bronze Star and the P.O.W. Medal. He has been a motivational speaker, consultant and executive coach since 1973. His clients include General Motors, Fedex, Hilton, Aflac, the U.S. Navy, BMW and NASA. Since 2010, he has been member of the Board of Directors of the Lightspeed Aviation Foundation. Captain Plumb earned a B.S. in electrical engineering from the U.S. Naval Academy at Annapolis. We selected Captain Plumb because of his close ties to the U.S. Defense establishment.
Mary Losty has been a director since July 2017. She is a private investor in both US equities and real estate. She currently serves as Commissioner on both Dorchester County and the City of Cambridge, Maryland’s Planning and Zoning Commissions. She also serves as a Committeeman for the Eastern Shore Land Conservancy as well as the Pine Street Committee of Cambridge, MD. She served as a member of the Board of Procera Networks, Inc. from March 2007 until that company was successfully sold in June 2015 to a private equity firm. She was a member of that company’s Audit Committee and the former Chairman of the Nominating and Governance Committee. Ms. Losty was a director of Blue Earth, Inc. (formerly Genesis Fluid Solutions Holdings, Inc.) from 2009 to 2011. Ms. Losty retired in 2010 as the General Partner at Cornwall Asset Management, LLC, a portfolio management firm located in Baltimore, Maryland, where she was responsible for the firm’s investment in numerous companies since 1998. Ms. Losty’s prior experience includes working as a portfolio manager at Duggan & Associates from 1992 to 1998 and as an equity research analyst at M. Kimelman & Company from 1990 to 1992. Prior to that, she worked as an investment banker at Morgan Stanley and Co., and for several years prior to that she was the top aide to James R. Schlesinger, a five-time U.S. cabinet secretary. Ms. Losty received both her BS and JD from Georgetown University, the latter with magna cum laude distinction. We believe that Ms. Losty’s extensive dealings with the investment community makes her highly qualified to be a member of our Board of Directors.
Family Relationships
Other than Tyler Runnels and Charlie Plumb who are brothers in law, none of our Directors are related by blood, marriage, or adoption to any other Director, executive officer, or other key employees.
| 38 |
Board Leadership Structure
The Board of Directors is currently chaired by the Chief Executive Officer of the Company, Annmarie Gayle. The Company believes that combining the positions of Chief Executive Officer and Chairman of the Board of Directors helps to ensure that the Board of Directors and management act with a common purpose. Integrating the positions of Chief Executive Officer and Chairman can provide a clear chain of command to execute the Company’s strategic initiatives. The Company also believes that it is advantageous to have a Chairman with an extensive history with, and knowledge of, the Company. Notwithstanding the combined role of Chief Executive Officer and Chairman, key strategic initiatives and decisions involving the Company are discussed and approved by the entire Board of Directors. The Company believes that the current leadership structure and processes maintains an effective oversight of management and independence of the Board of Directors as a whole without separate designation of a lead independent director. However, the Board of Directors will continue to monitor its functioning and will consider appropriate changes to ensure the effective independent function of the Board of Directors in its oversight responsibilities.
Independence of the Board of Directors and its Committees
After review of all relevant transactions or relationships between each director, or any of his or her family members, and the Company, its senior management and its Independent Registered Public Accounting Firm, the Board of Directors has determined that all of the Company’s directors are independent within the meaning of the applicable NASDAQ listing standards, except Ms. Gayle, the Company’s Chairman and Chief Executive Officer. The Board of Directors met five (5) times and acted by unanimous written consent four times during the fiscal year ended October 31, 2020. Each member of the Board of Directors attended all meetings of the Board of Directors held in the last fiscal year during the period for which he or she was a director and of the meetings of the committees on which he or she served in the last fiscal year during the period for which he or she was a committee member.
The Board of Directors has three committees: the Audit Committee, the Compensation Committee and the Nominating Committee. Below is a description of each committee of the Board of Directors. The Board of Directors has determined that each member of each committee meets the applicable rules and regulations regarding “independence” and that each member is free of any relationship that would interfere with his or her individual exercise of independent judgment with regard to the Company.
Audit Committee
The Audit Committee of the Board of Directors oversees the Company’s corporate accounting and financial reporting process. For this purpose, the Audit Committee performs several functions. The Audit Committee, among other things: evaluates the performance, and assesses the qualifications, of the Independent Registered Public Accounting Firm; determines and pre-approves the engagement of the Independent Registered Public Accounting Firm to perform all proposed audit, review and attest services; reviews and pre-approves the retention of the Independent Registered Public Accounting Firm to perform any proposed, permissible non-audit services; determines whether to retain or terminate the existing Independent Registered Public Accounting Firm or to appoint and engage a new independent registered Public Accounting Firm for the ensuing year; confers with management and the Independent Registered Public Accounting Firm regarding the effectiveness of internal control over financial reporting; establishes procedures as required under applicable law, for the receipt, retention and treatment of complaints received by the Company regarding accounting, internal accounting controls or auditing matters and the confidential and anonymous submission by employees of concerns regarding questionable accounting or auditing matters; reviews the financial statements to be included in the Company’s Annual Report on Form 10-K and the Company’s periodic quarterly filings on Form 10-Q, recommends whether or not such financial statements should be so included; and discusses with management and the Independent Registered Public Accounting Firm the results of the annual audit and review of the Company’s quarterly financial statements.
The Audit Committee is currently composed of three outside directors: Michael Hamilton (Chairman), Mary Losty and Captain J. Charles Plumb. The Audit Committee met four (4) times during the fiscal year ended October 31, 2020. The Audit Committee Charter is available on the Company’s website, www.codaoctopusgroup.com.
| 39 |
The Board of Directors periodically reviews the NASDAQ listing standards’ definition of independence for Audit Committee members and has determined that all members of the Company’s Audit Committee are independent (as independence is currently defined in Rule 5605(c)(2)(A) of the NASDAQ listing standards and Rule 10A-3(b)(1) of the Securities Exchange Act, as amended). The Board of Directors has determined that Michael Hamilton qualifies as an “audit committee financial expert,” as defined in applicable SEC rules. The Board of Directors made a qualitative assessment of Mr. Hamilton’s level of knowledge and experience based on a number of factors, including his formal education and his service in executive capacities having financial oversight responsibilities.
Compensation Committee
The Compensation Committee of the Board of Directors reviews, modifies and approves the overall compensation strategy and policies for the Company. The Compensation Committee, among other things, reviews and approves corporate performance goals and objectives relevant to the compensation of the Company’s officers; determines and approves the compensation and other terms of employment of the Company’s Chief Executive Officer; determines and approves the compensation and other terms of employment of the other officers of the Company; and administers the Company’s stock option and purchase plans, pension and profit sharing plans and other similar programs.
The Compensation Committee is composed of three outside directors: Chairman Captain J. Charles Plumb, Mary Losty and G. Tyler Runnels. All members of the Compensation Committee are independent (as independence is currently defined in Rule 5605(a)(2) of the NASDAQ listing standards). The Compensation Committee met three times during the fiscal year ended October 31, 2020. The Compensation Committee Charter is available on the Company’s website at: www.codaoctopusgroup.com.
Compensation Committee Interlocks and Insider Participation
No member of our compensation committee has at any time been an employee of ours. None of our executive officers serves as a member of the board of directors or compensation committee of any entity that has one or more executive officers serving as a member of our board of directors or compensation committee.
Nominating Committee
The Nominating Committee of the Board of Directors is responsible for, among other things, identifying, reviewing and evaluating candidates to serve as directors of the Company; reviewing, evaluating and considering incumbent directors; recommending to the Board of Directors for selection candidates for election to the Board of Directors; making recommendations to the Board of Directors regarding the membership of the committees of the Board of Directors, and assessing the performance of the Board of Directors.
The Nominating and Governance Committee is currently composed of three outside directors: Mary Losty (Chair), G. Tyler Runnels and Captain J. Charles Plumb. All members of the Nominating Committee are independent (as independence is currently defined in Rule 5605(a)(2) of the NASDAQ listing standards). The Nominating Committee met one time during the fiscal year ended October 31, 2020. The Nominating Committee Charter is available on the Company’s website at www.codaoctopusgroup.com.
The Nominating Committee has not established any specific minimum qualifications that must be met for recommendation for a position on the Board of Directors. Instead, in considering candidates for director the Nominating Committee will generally consider all relevant factors, including among others the candidate’s applicable education, expertise and demonstrated excellence in his or her field, the usefulness of the expertise to the Company, the availability of the candidate to devote sufficient time and attention to the affairs of the Company, the candidate’s reputation for personal integrity and ethics and the candidate’s ability to exercise sound business judgment. Other relevant factors, including diversity, experience and skills, will also be considered. Candidates for director are reviewed in the context of the existing membership of the Board of Directors (including the qualities and skills of the existing directors), the operating requirements of the Company and the long-term interests of its stockholders.
| 40 |
The Nominating Committee considers each director’s executive experience and his or her familiarity and experience with the various operational, scientific and/or financial aspects of managing companies in our industry.
With respect to diversity, the Nominating Committee seeks a diverse group of individuals who have executive leadership experience and a complementary mix of backgrounds and skills necessary to provide meaningful oversight of the Company’s activities. The Company meets the proposed NASDAQ standards for diversity on the board of directors. The Nominating Committee annually reviews the Board’s composition in light of the Company’s changing requirements. The Nominating Committee uses the Board of Director’s network of contacts when compiling a list of potential director candidates and may also engage outside consultants. Pursuant to its charter, the Nominating Committee will consider, but not necessarily recommend to the Board of Directors, potential director candidates recommended by stockholders. All potential director candidates are evaluated based on the factors set forth above, and the Nominating Committee has established no special procedure for the consideration of director candidates recommended by stockholders.
Employment Agreements
Annmarie Gayle
Pursuant to the terms of an employment agreement dated March 16, 2017, the Company employs Ms. Gayle as its Chief Executive Officer on a full-time basis and a member of its Board of Directors. Effective July 1, 2019, Ms. Gayle’s annual salary was revised from $230,000 to $305,000. She is also entitled to an annual performance bonus of up to $100,000, upon achieving certain targets that are to be defined on an annual basis. The agreement provides for 30 days of paid vacation in addition to public holidays observed in Denmark.
The agreement has no definitive term and may be terminated upon twelve months’ prior written notice by Ms. Gayle. In the event that the Company terminates her at any time without cause, she is entitled to a payment equal to her annual salary as well as a separation bonus of $150,000. The Company may terminate the agreement for cause, immediately and without notice. Among others, “for cause” includes gross misconduct, a serious or repeated breach of the agreement and negligence and incompetence as reasonably determined by the Company’s Board. The agreement includes a 12-month non-compete and non-solicitation provision.
Blair Cunningham
Under the terms of an employment contract dated January 1, 2013, our wholly owned subsidiary Coda Octopus Products, Inc. employs Blair Cunningham as its Chief Executive Officer and President of Technology. He is being paid an annual base salary of $200,000 with effect from January 1, 2020, subject to review by the Company’s Chief Executive Officer. Mr. Cunningham is entitled to 25 vacation days in addition to any public holiday.
The agreement may be terminated only upon twelve-month prior written notice without cause. The Company may terminate the agreement for cause, immediately and without notice. Among others, “for cause” includes gross misconduct, a serious or repeated breach of the agreement and negligence and incompetence as reasonably determined by the Company’s Board. The agreement includes an 18-month non-compete and non-solicitation provision.
Michael Midgley
Pursuant to the terms of an employment agreement dated June 1, 2011, Mike Midgley was appointed the Chief Executive Officer of our wholly owned subsidiary Coda Octopus Colmek, Inc and our Chief Financial Officer. He is being paid an annual salary of $210,000 with effect from January 1, 2020 subject to an annual review by Colmek’s Board of Directors and the Company’s Chief Executive Officer. Mr. Midgley is entitled to 20 vacation days in addition to any public holiday.
The agreement may be terminated at any time upon 4 months prior written notice. The Company may terminate the agreement for cause, immediately and without notice. Among others, “for cause” includes gross misconduct, a serious or repeated breach of the agreement and negligence and incompetence as reasonably determined by the Company’s Board. The agreement includes a 12-month non-compete and non-solicitation provision. On December 6, 2017, the board of directors of the Company appointed Mr. Midgley to be the Company’s Chief Financial Officer. In connection with this appointment, all rights and obligations under Mr. Midgley’s employment agreement with Colmek were transferred to and have been assumed by the Company.
Code of Ethics
We have adopted a code of ethics for all our employees, including our chief executive officer, principal financial officer and principal accounting officer or controller, and/or persons performing similar functions, which is available on our website, under the link entitled “Code of Ethics”.
| 41 |
ITEM 11. EXECUTIVE COMPENSATION
The Summary Compensation Table shows certain compensation information for services rendered for the fiscal years ended October 31, 2020 and 2019 by our executive officers. The following information includes the dollar value of base salaries, bonus awards, stock options grants and certain other compensation, if any, whether paid or deferred.
| Name
and Principal Position |
Year | Salary | Bonus | Restricted Stock Awards | Option Awards | * All Other Compensation | Total | |||||||||||||||||||
| ($) | ($) | ($) | ($) | ($) | ($) | |||||||||||||||||||||
| Annmarie Gayle** | 2020 | ***271,115 |
-0- | -0- | 221,000 |
-0- | 492,115 |
|||||||||||||||||||
| Chief Executive Officer | 2019 | 255,003 | -0- | -0- | -0- | -0- | 255,003 | |||||||||||||||||||
| Michael Midgley | 2020 | 208,077 | -0- | -0- | 221,000 | 15,988 | 445,065 | |||||||||||||||||||
| Chief Financial Officer | 2019 | 200,000 | -0- | -0- | -0- | 7,479 | 207,579 | |||||||||||||||||||
| Blair Cunningham | 2020 | 195,192 |
-0- | -0- | 165,750 | 19,257 | 380,199 | |||||||||||||||||||
| President of Technology | 2019 | 179,000 | -0- | -0- | -0- | 18,952 | 197,952 | |||||||||||||||||||
*The amounts described in the category of “All Other Compensation” comprise Health, Dental, Vision, Short Term Disability, Long Term Disability and Accidental Death and Dismemberment insurance premiums which the Company contributed to the officers’ identified plan.
**Ms. Gayle’s salary was increased effective July 1, 2019.
*** Ms. Gayle’s annual salary is $305,000. During the Pandemic she waived certain amounts of her salary as is disclosed on Form 8-K filed with the SEC in 2020.
Grants of plan-based awards at October 31, 2020
| Name | Grant Date | All
other option awards; number of securities underlying options | Exercise
or base price of option swards | Grant
date fair value of option awards | ||||||||||
| Annmarie Gayle | 3/23/2020 | 100,000 | 4.62 | 221,000 | ||||||||||
| Michael Midgley | 3/23/2020 | 100,000 | 4.62 | 221,000 | ||||||||||
| Blair Cunningham | 3/23/2020 | 75,000 | 4.62 | 165,750 | ||||||||||
Outstanding option awards at October 31, 2020
| Option Awards | ||||||||||||||
| Name | Number
of securities underlying unexercised options exercisable | Number
of securities underlying unexercised options unexercisable | Exercise or base price of option swards | Option
expiration date | ||||||||||
| Annmarie Gayle | 100,000 | - | 4.62 | 3/23/2023 | ||||||||||
| Michael Midgley | 100,000 | - | 4.62 | 3/23/2023 | ||||||||||
| Blair Cunningham | 75,000 | - | 4.62 | 3/23/2023 | ||||||||||
Option exercises for October 31, 2020
| Option Awards | ||||||||
| Name | Number
of shares acquired on exercise | Value
realized on exercise | ||||||
| Annmarie Gayle | - | - | ||||||
| Michael Midgley | - | - | ||||||
| Blair Cunningham | - | - | ||||||
DIRECTOR COMPENSATION
The following table sets forth the compensation paid to each of our directors (who are not also officers of the Company) for the fiscal year ended October 31, 2020, in connection with their services to the company. In accordance with the SEC’s rules, the table omits columns showing items that are not applicable. Except as set forth in the table, no other persons were paid any compensation for director services.
| Name | **Fees
Earned or Paid in Cash ($) | Stock
Awards ($) | Total
($) | |||||||||
| Michael Hamilton | 30,000 | - | 30,000 | |||||||||
| Captain J Charles Plumb | 30,000 | - | 30,000 | |||||||||
| Mary Losty | 30,000 | - | 30,000 | |||||||||
| Tyler G Runnels | 30,000 | 30,000 | ||||||||||
** In 2020 FY, each Board Member waived one Quarter’s Fee Payment as part of the cost reduction effort relating to the Company’s Pandemic response, as is disclosed on Form 8K filed with the SEC in 2020.
2017 Stock Incentive Plan
On December 6, 2017, the Board of Directors adopted the 2017 Stock Incentive Plan (the “Plan”). The purpose of the Plan is to advance the interests of the Company and its stockholders by enabling the Company and its subsidiaries to attract and retain qualified individuals through opportunities for equity participation in the Company, and to reward those individuals who contribute to the Company’s achievement of its economic objectives. The Plan was adopted subject to stockholders’ approval. This Plan was approved by Stockholders at its meeting held on or around July 24, 2018.
The maximum number of shares of Common Stock that will be available for issuance under the Plan is 913,612. The shares available for issuance under the Plan may, at the election of the Committee, be either treasury shares or shares authorized but unissued, and, if treasury shares are used, all references in the Plan to the issuance of shares will, for corporate law purposes, be deemed to mean the transfer of shares from treasury.
The Plan is administered by the Compensation Committee of the Board of Directors which has the authority to determine all provisions of Incentive Awards as the Committee may deem necessary or desirable and as consistent with the terms of the Plan, including, without limitation, the following: (i) eligible recipients; (ii) the nature and extent of the Incentive Awards to be made to each Participant; (iii) the time or times when Incentive Awards will be granted; (iv) the duration of each Incentive Award; and (v) the restrictions and other conditions to which the payment or vesting of Incentive Awards may be subject.
During the fiscal year ended October 31, 2020, the Company granted options to purchase an aggregate of 564,000 shares of common stock pursuant to the terms of the Plan to various eligible individuals. During the year 3,000 options were forfeited. As a result, as of October 31, 2020, there were 319,255 shares available for future issue under the Plan.
Section 16(a) Beneficial Ownership Reporting Compliance
Under the Exchange Act, our directors, our executive officers, and any persons holding more than 10% of our common stock are required to report their ownership of the common stock and any changes in that ownership to the SEC. To our knowledge, based solely on our review of the copies of such reports received or written representations from certain reporting persons that no other reports were required, except as set forth below, we believe that during our fiscal year ended October 31, 2020, no reports relating to our securities required to be filed by current reporting persons were filed late.
Entities affiliated with Bryan Ezralow were late in their filing of a Form 4 relating to transactions that took place during March 2020.
Maty Losty, one of our directors, was one day late in her filing of a Form 4 relating to a transaction that took place on April 8, 2020.
We will continue monitoring Section 16 compliance by each of our directors and executive officers and will assist them where possible in their filing obligations.
| 42 |
ITEM 12. SECURITY OWNERSHIP OF CERTAIN BENEFICIAL OWNERS AND MANAGEMENT AND RELATED STOCKHOLDER MATTERS
The following table sets forth information as of January 28, 2021, regarding the beneficial ownership of our Common Stock, based on information provided by (i) each of our executive officers and directors; (ii) all executive officers and directors as a group; and (iii) each person who is known by us to beneficially own more than 5% of the outstanding shares of our Common Stock. The percentage ownership in this table is based on 10,751,881 shares issued and outstanding as of January 28, 2021.
Unless otherwise indicated, we believe that all persons named in the following table have sole voting and investment power with respect to all shares of Common Stock that they beneficially own.
| Name and Address of Beneficial Owner (1) | Amount
and Nature of Beneficial Ownership of Common Stock | Percent
of Common Stock | ||||||
| Michael Hamilton | 1,143 | * | ||||||
| Annmarie Gayle (2) | 2,330,523 | 21.7 | % | |||||
| Michael Midgley | -0- | * | ||||||
| Blair Cunningham | 24,297 | * | ||||||
| J. Charles Plumb | 11,434 | * | ||||||
| Mary Losty | 57,143 | * | ||||||
Niels Sondergaard Carit
Etlars Vej 17A | 2,317,486 | 21.6 | % | |||||
G. Tyler Runnels (3) 2049 Century Park East, Suite 320 Los Angeles, CA 90067 | 1,125,685 | 10.5 | % | |||||
J. Steven Emerson (4) 1522 Ensley Avenue Los Angeles, CA 90024 | 1,244,159 | 11.6 | % | |||||
Bryan Ezralow (5) 23622 Calabasas Rd. Suite 200 Calabasas, CA 91302 | 1,073,120 | 9.9 | % | |||||
FH Fentener van Vlissingen (6) Albert Hahnplantsoen 23 Amsterdam The Netherlands | 592,958 | 5.5 | % | |||||
| All Directors and Executive Officers as a Group (Seven persons): | 3,550,225 | 33.1 | % | |||||
*) Less than 1%.
| 1) | Unless otherwise indicated, the address of all individuals and entities listed below is c/o Coda Octopus Group, Inc. 3300 S Hiawassee Rd, Suite 104-105, Orlando, Florida, 32835. |
| 2) | Includes 2,317,486 shares beneficially owned by Ms. Gayle’s spouse, Niels Sondergaard. Ms. Gayle disclaims any beneficial ownership in those shares. |
| 3) | Includes 859,331 shares held by the G. Tyler Runnels and Jasmine Niklas Runnels TTEES of The Runnels Family Trust DTD 1-11-2000 of which Mr. Runnels is a trustee; 227,700 shares held by T.R. Winston; 24,368 shares held by TRW Capital Growth Fund, Ltd.; and 14,286 shares held by Pangaea Partners. The Company has been advised that Mr. Runnels has voting and dispositive power with respect to all of these shares. |
| 4) | Includes the following: 167,081 held by J. Steven Emerson IRA R/O II; 300,000 shares held by J. Steven Emerson Roth IRA; 49,328 shares held by the Brian Emerson IRA; 310,928 shares held by Emerson Partners; 400,250 shares held by 1993 Emerson Family Trust; 8,286 shares held by the Alleghany Meadows IRA; 8,286 shares held by the Jill Meadows IRA; and 24,073 shares held by the Emerson family Foundation. The Company has been advised that Mr. Emerson has voting and dispositive power with respect to all of these shares. |
| 5) | Consists of 896,079 shares held by the Bryan Ezralow 1994 Trust u/t/d 12/22/1994; and 177,041 shares held by EZ MM&B Holdings, LLC. The Company has been advised that Mr. Ezralow has voting and dispositive power with respect to these shares. |
| 6) | According to filings made with the SEC, Sandy Hills BV directly owns all of the shares reported herewith. Malabar Hill NV, as the statutory director of Sandy Hills BV, and Drs F.H. van Vlissingen, as statutory director of Malabar Hill NV, have voting and dispositive power over the shares held by Sandy Hills BV. |
| 43 |
ITEM 13. CERTAIN RELATIONSHIPS AND RELATED TRANSACTIONS, AND DIRECTOR INDEPENDENCE
None that are required to be reported herein.
ITEM 14. PRINCIPAL ACCOUNTANT FEES AND SERVICES
Audit Fees. The aggregate fees billed by Frazier & Deeter, LLC, our principal accountants, for professional services rendered for the audit of the Company’s annual financial statements for the last two fiscal years and for the reviews of the financial statements included in the Company’s Quarterly reports on Form 10-Q during the last two fiscal years 2020 and 2019 were $212,369 and $204,198 respectively.
Audit-Related Fees. The aggregate fees billed by Frazier & Deeter, LLC, our principal accountants, for professional services rendered in connection with the audits of the Company, the review of and consent to the filing of registration statements, and assistance in responding to comment letters issued by the Securities & Exchange Commission during the last two fiscal years 2020 and 2019 were $0 and $0, respectively.
Tax Fees. The Company did not engage its principal accountants to render any tax services to the Company during the last two fiscal years.
All Other Fees. The Company did not engage its principal accountants to render services to the Company during the last two fiscal years, other than as reported above.
Prior to the Company’s engagement of its independent auditor, such engagement is approved by the Company’s audit committee. The services provided under this engagement may include audit services, audit-related services, tax services and other services. Pre-approval is generally provided for up to one year and any pre-approval is detailed as to the particular service or category of services and is generally subject to a specific budget. Pursuant to the Company’s Audit Committee Charter, the independent auditors and management are required to report to the Company’s audit committee at least quarterly regarding the extent of services provided by the independent auditors in accordance with this pre-approval, and the fees for the services performed to date. The audit committee may also pre-approve particular services on a case-by-case basis. All audit-related fees, tax fees and other fees incurred by the Company for the year ended October 31, 2020, were approved by the Company’s audit committee.
| 44 |
ITEM 15. EXHIBITS, FINANCIAL STATEMENT SCHEDULES
| * | Incorporated by reference to the Company’s Registration Statement on Form SB-2 (SEC File No.143144) | |
| ** | Incorporated by reference to the Company’s Registration Statement on Form 10. | |
| *** | Incorporated by reference to the Company’s Annual Report on Form 10-KSB for the year ended October 31, 2007 | |
| **** | Incorporated by reference to the Company’s Annual Report on Form 10-KSB for the year ended October 31, 2010 | |
| ***** | Incorporated by reference to the Company’s Registration Statement on Form 10/A filed March 29,2017 | |
| ****** | Incorporated by reference to the Company’s Current Report on Form 8-K filed May 2, 2017 | |
| ******* | Incorporated by reference to the Company’s Annual Report on Form 10 for the year ended October 31, 2017 |
| 45 |
Pursuant to the requirements of Section 13 or 15(d) of the Securities Exchange Act of 1934, as amended, the Registrant has duly caused this report to be signed on its behalf by the undersigned thereunto duly authorized.
| DATE: January 28, 2021 | CODA OCTOPUS GROUP, INC. |
| /s/ Annmarie Gayle | |
| Chief Executive Officer |
POWER OF ATTORNEY
Each person whose signature appears below constitutes and appoints Annmarie Gayle, his or her true and lawful attorney-in-fact and agent, with full power of substitution and re-substitution, severally, for him or her and in his or her name, place and stead, in any and all capacities, to sign any and all amendments to this annual report on Form 10-K, and to file the same, with all exhibits thereto and other documents in connection therewith, with the Securities and Exchange Commission, granting unto said attorneys-in-fact and agents, and each of them, full power and authority to do and perform each and every act and thing requisite and necessary to be done in and about the premises, as fully to all intents and purposes as he might or could do in person, hereby ratifying and confirming all that said attorneys-in-fact and agents, or any of them or their or his or her substitute or substitutes, may lawfully do or cause to be done by virtue hereof. This power of attorney may be executed in counterparts.
Pursuant to the requirements of the Securities Exchange Act of 1934, this report has been signed below by the following persons on behalf of the registrant and in the capacities and on the dates indicated.
| Signature | Title | Date | ||
| /s/ Annmarie Gayle | Chief Executive Officer and Chairman | January 28, 2021 | ||
| Annmarie Gayle | (Principal Executive Officer) | |||
| /s/ Michael Midgley | Chief Financial Officer | January 28, 2021 | ||
| Michael Midgley | (Principal Financial and Accounting Officer) | |||
| /s/ Michael Hamilton | Director | January 28, 2021 | ||
| Michael Hamilton | ||||
| /s/ Captain Charlie Plumb | Director | January 28, 2021 | ||
| Charlie Plumb | ||||
| /s/ Mary Losty | Director | January 28, 2021 | ||
| Mary Losty | ||||
| /s/ G. Tyler Runnels | Director | January 28, 2021 |
| 46 |
CODA OCTOPUS GROUP, INC.
INDEX TO CONSOLIDATED FINANCIAL STATEMENTS
REPORT OF INDEPENDENT REGISTERED PUBLIC ACCOUNTING FIRM
To the Board of Directors and Stockholders of
Coda Octopus Group, Inc.
Opinion on the Consolidated Financial Statements
We have audited the accompanying consolidated balance sheets of Coda Octopus Group, Inc. and subsidiaries (the “Company”) as of October 31, 2020 and 2019, and the related consolidated statements of income and comprehensive income, changes in stockholders’ equity, and cash flows for the years ended October 31, 2020 and 2019, and the related notes (collectively referred to as the consolidated financial statements). In our opinion, the consolidated financial statements present fairly, in all material respects, the financial position of the Company as of October 31, 2020 and 2019, and the results of their operations and cash flows for the years then ended in conformity with accounting principles generally accepted in the United States of America.
Basis for Opinion
These consolidated financial statements are the responsibility of the Company’s management. Our responsibility is to express an opinion on the Company’s consolidated financial statements based on our audits. We are a public accounting firm registered with the Public Company Accounting Oversight Board (United States) (“PCAOB”) and are required to be independent with respect to the Company in accordance with the U.S. federal securities laws and the applicable rules and regulations of the Securities and Exchange Commission and the PCAOB.
We conducted our audits in accordance with the standards of the PCAOB. Those standards require that we plan and perform the audit to obtain reasonable assurance about whether the consolidated financial statements are free of material misstatement, whether due to error or fraud. The Company is not required to have, nor were we engaged to perform, an audit of its internal control over financial reporting. As part of our audits we are required to obtain an understanding of internal control over financial reporting but not for the purpose of expressing an opinion on the effectiveness of the Company’s internal control over financial reporting. Accordingly, we express no such opinion.
Our audits included performing procedures to assess the risks of material misstatement of the consolidated financial statements, whether due to error or fraud, and performing procedures that respond to those risks. Such procedures included examining, on a test basis, evidence regarding the amounts and disclosures in the consolidated financial statements. Our audits also included evaluating the accounting principles used and significant estimates made by management, as well as evaluating the overall presentation of the consolidated financial statements. We believe that our audits provide a reasonable basis for our opinion.
We have served as the Company’s auditor since 2014.
| /s/ Frazier & Deeter, LLC | |
| Tampa, Florida | |
| January 28, 2021 |
| F-1 |
Consolidated Balance Sheets
October 31, 2020 and October 31, 2019
| 2020 | 2019 | |||||||
| ASSETS | ||||||||
| CURRENT ASSETS | ||||||||
| Cash | $ | 15,134,289 | $ | 11,721,683 | ||||
| Accounts Receivable, net | 2,014,660 | 4,431,971 | ||||||
| Inventory | 9,142,273 | 5,350,514 | ||||||
| Unbilled Receivables | 861,300 | 2,279,362 | ||||||
| Other Current Assets | 244,171 | 298,187 | ||||||
| Prepaid Expenses | 289,204 | 198,140 | ||||||
| Total Current Assets | 27,685,897 | 24,279,857 | ||||||
| FIXED ASSETS | ||||||||
| Property and Equipment, net | 6,059,900 | 5,986,812 | ||||||
| OTHER ASSETS | ||||||||
| Goodwill and Other Intangibles, net | 3,731,452 | 3,612,891 | ||||||
| Deferred Tax Asset | 561,902 | 631,684 | ||||||
| Total Other Assets | 4,293,354 | 4,244,575 | ||||||
| Total Assets | $ | 38,039,151 | $ | 34,511,244 | ||||
The accompanying notes are an integral part of these consolidated financial statements
| F-2 |
Consolidated Balance Sheets (Continued)
October 31, 2020 and October 31, 2019
| 2020 | 2019 | |||||||
| LIABILITIES AND STOCKHOLDERS’ EQUITY | ||||||||
| CURRENT LIABILITIES | ||||||||
| Accounts Payable | $ | 1,284,097 | $ | 1,273,490 | ||||
| Accrued Expenses and Other Current Liabilities | 584,202 | 576,672 | ||||||
| Notes Payable | 509,769 | 487,140 | ||||||
| Deferred Revenue | 1,006,454 | 830,148 | ||||||
| Total Current Liabilities | 3,384,522 | 3,167,450 | ||||||
| LONG TERM LIABILITIES | ||||||||
| Deferred Revenue, less current portion | 195,022 | 143,587 | ||||||
| Notes Payable, less current portion | 63,339 | 572,434 | ||||||
| Total Long Term Liabilities | 258,361 | 716,021 | ||||||
| Total Liabilities | 3,642,883 | 3,883,471 | ||||||
| STOCKHOLDERS’ EQUITY | ||||||||
| Common Stock, $.001 par value; 150,000,000 shares authorized, 10,751,881 and 10,721,881 shares issued and outstanding as of October 31, 2020 and 2019, respectively | 10,753 | 10,723 | ||||||
| Additional Paid-in Capital | 60,132,415 | 59,521,665 | ||||||
| Accumulated Other Comprehensive Loss | (2,321,278 | ) | (2,135,408 | ) | ||||
| Accumulated Deficit | (23,425,622 | ) | (26,769,207 | ) | ||||
| Total Stockholders’ Equity | 34,396,268 | 30,627,773 | ||||||
| Total Liabilities and Stockholders’ Equity | $ | 38,039,151 | $ | 34,511,244 | ||||
The accompanying notes are an integral part of these consolidated financial statements
| F-3 |
Consolidated Statements of Income and Comprehensive Income
For the Periods Indicated
| Year Ended October 31, | ||||||||
| 2020 | 2019 | |||||||
| Net Revenues | $ | 20,043,810 | $ | 25,056,934 | ||||
| Cost of Revenues | 7,314,362 | 8,627,615 | ||||||
| Gross Profit | 12,729,448 | 16,429,319 | ||||||
| OPERATING EXPENSES | ||||||||
| Research & Development | 3,188,389 | 2,801,331 | ||||||
| Selling, General & Administrative | 6,737,294 | 7,374,551 | ||||||
| Total Operating Expenses | 9,925,683 | 10,175,882 | ||||||
| INCOME FROM OPERATIONS | 2,803,765 | 6,253,437 | ||||||
| OTHER INCOME (EXPENSE) | ||||||||
| Other Income | 19,374 | 70,212 | ||||||
| Funding from Paycheck Protection Program | 648,871 |
- |
||||||
| Interest Expense | (70,203 | ) | (91,096 | ) | ||||
| Total Other Income (Expense) | 598,042 | (20,884 | ) | |||||
| NET INCOME BEFORE INCOME TAXES | 3,401,807 | 6,232,553 | ||||||
| INCOME TAX BENEFIT (EXPENSE) | ||||||||
| Current Tax Benefit | 50,663 | 39,422 | ||||||
| Deferred Tax Expense | (108,885 | ) | (1,046,776 | ) | ||||
| Total Income Tax Expense | (58,222 | ) | (1,007,354 | ) | ||||
| NET INCOME | $ | 3,343,585 |
$ | 5,225,199 | ||||
| NET INCOME PER SHARE: | ||||||||
| Basic | $ | 0.31 | $ | 0.49 | ||||
| Diluted | $ | 0.30 | $ | 0.49 | ||||
| WEIGHTED AVERAGE SHARES: | ||||||||
| Basic | 10,733,799 | 10,680,007 | ||||||
| Diluted | 11,294,799 | 10,680,007 | ||||||
| NET INCOME | $ | 3,343,585 |
$ | 5,225,199 | ||||
| Foreign Currency Translation Adjustment | (185,870 | ) | 93,255 | |||||
| Total Other Comprehensive Income (Loss) | (185,870 | ) | 93,255 | |||||
| COMPREHENSIVE INCOME | $ | 3,157,715 | $ | 5,318,454 | ||||
The accompanying notes are an integral part of these consolidated financial statements
| F-4 |
Consolidated Statements of Changes in Stockholders’ Equity
For the Years Ended October 31, 2020 and 2019
| Accumulated | ||||||||||||||||||||||||
| Additional | Other | |||||||||||||||||||||||
| Common Stock | Paid-in | Comprehensive | Accumulated | |||||||||||||||||||||
| Shares | Amount | Capital | Income (Loss) | Deficit | Total | |||||||||||||||||||
| Balance, October 31, 2018 | 10,640,416 | $ | 10,641 | $ | 58,599,378 | $ | (2,228,663 | ) | $ | (31,994,406 | ) | $ | 24,386,950 | |||||||||||
| Stock Issued to Investors | 23,965 | 25 | 105,421 | - | - | 105,446 | ||||||||||||||||||
| Director stock based compensation | 32,143 | 32 | 302,757 | - | - | 302,789 | ||||||||||||||||||
| Employee stock based compensation | 5,357 | 5 | 55,815 | - | - | 55,820 | ||||||||||||||||||
| Consultant stock based compensation | 20,000 | 20 | 291,780 | - | - | 291,800 | ||||||||||||||||||
| Disgorgement of stock sales | - | - | 166,514 | - | - | 166,514 | ||||||||||||||||||
| Foreign currency translation adjustment | - | - | - | 93,255 | - | 93,255 | ||||||||||||||||||
| Net Income | - | - | - | - | 5,225,199 | 5,225,199 | ||||||||||||||||||
| Balance, October 31, 2019 | 10,721,881 | 10,723 | 59,521,665 | (2,135,408 | ) | (26,769,207 | ) | 30,627,773 | ||||||||||||||||
| Employee stock based compensation | - | - | 441,280 | - | - | 441,280 | ||||||||||||||||||
| Consultant stock based compensation | 30,000 | 30 | 169,470 | - | - | 169,500 | ||||||||||||||||||
| Foreign currency translation adjustment | - | - | - | (185,870 | ) | - | (185,870 | ) | ||||||||||||||||
| Net Income | - | - | - | - | 3,343,585 | 3,343,585 | ||||||||||||||||||
| Balance, October 31, 2020 | 10,751,881 | $ | 10,753 | $ | 60,132,415 | $ | (2,321,278 | ) | $ | (23,425,622 | ) | $ | 34,396,268 | |||||||||||
The accompanying notes are an integral part of these consolidated financial statements
| F-5 |
Consolidated Statements of Cash Flows
| Year Ended October 31, | ||||||||
| 2020 | 2019 | |||||||
| CASH FLOWS FROM OPERATING ACTIVITIES | ||||||||
| Net income | $ | 3,343,585 | $ | 5,225,199 | ||||
| Adjustments to reconcile net income to net cash provided by operating activities: | ||||||||
| Depreciation and amortization | 806,686 | 833,775 | ||||||
| Stock based compensation | 610,780 | 650,409 | ||||||
| Deferred tax asset | 69,782 | 1,122,485 | ||||||
| Funding from Paycheck Protection Program recognized as income | (648,871 | ) | - | |||||
| Loss on the sale of property and equipment | - | 9,215 | ||||||
| (Increase) decrease in operating assets: | ||||||||
| Accounts receivable | 2,417,311 | (1,105,349 | ) | |||||
| Inventory | (3,791,759 | ) | (1,527,271 | ) | ||||
| Unbilled receivables | 1,418,062 | 733,754 | ||||||
| Other current assets | 54,016 | (78,762 | ) | |||||
| Prepaid expenses | (91,064 | ) | 29,339 | |||||
| Increase (decrease) in operating liabilities: | ||||||||
| Accounts payable and other current liabilities | 18,137 | 176,560 | ||||||
| Deferred revenue | 227,741 | 321,915 | ||||||
| Net Cash Provided by Operating Activities | 4,434,406 | 6,391,269 | ||||||
| CASH FLOWS FROM INVESTING ACTIVITIES | ||||||||
| Purchases of property and equipment | (835,132 | ) | (2,263,007 | ) | ||||
| Proceeds from sales of property and equipment | - | 719,077 | ||||||
| Purchases of other goodwill and intangible assets | (163,203 | ) | (38,628 | ) | ||||
| Net Cash Used in Investing Activities | (998,335 | ) | (1,582,558 | ) | ||||
| CASH FLOWS FROM FINANCING ACTIVITIES | ||||||||
| Repayment of notes | (486,466 | ) | (964,665 | ) | ||||
| Disgorgement of stock sales | - | 166,514 | ||||||
| Proceeds from Paycheck Protection Program | 648,871 | - | ||||||
| Issuance of common stock for cash | - | 105,446 | ||||||
| Net Cash Provided (Used) in Financing Activities | 162,405 | (692,705 | ) | |||||
| EFFECT OF CURRENCY EXCHANGE RATE ON CHANGES IN CASH | (185,870 | ) | 93,255 | |||||
| NET INCREASE IN CASH | 3,412,606 | 4,209,261 | ||||||
| CASH AT THE BEGINNING OF THE PERIOD | 11,721,683 | 7,512,422 | ||||||
| CASH AT THE END OF THE PERIOD | $ | 15,134,289 | $ | 11,721,683 | ||||
| SUPPLEMENTAL CASH FLOW INFORMATION | ||||||||
| Cash paid for interest | $ | 70,202 | $ | 91,097 | ||||
| Cash paid for taxes | $ | - | $ | 7,840 | ||||
The accompanying notes are an integral part of these consolidated financial statements
| F-6 |
Notes to the Consolidated Financial Statements
October 31, 2020 and 2019
NOTE 1 – ORGANIZATION AND DESCRIPTION OF BUSINESS
Coda Octopus Group, Inc. (“Coda,” “the Company,” or “we”) operates two distinct operating business units. These are Marine Technology Business (“Products Business”) and Marine Engineering Business (“Services Business”). The Marine Technology Business sells solutions which it designs, develops and manufactures to the subsea market. Among the solutions it designs and develops its real time volumetric imaging sonar which is a unique and leading product in the subsea/underwater market. The Marine Engineering Business supplies proprietary parts for which it enjoys sole source status to prime defense contractors. These parts are part of a broader sub-system into mission critical defense systems.
The consolidated financial statements include the accounts of Coda Octopus Group, Inc. and our domestic and foreign subsidiaries. All significant intercompany transactions and balances have been eliminated in the consolidated financial statements.
NOTE 2 - SUMMARY OF ACCOUNTING POLICIES
a. Basis of Presentation
The Company has adopted the Financial Accounting Standards Board (FASB) Codification (Codification). The Codification is the single official source of authoritative accounting principles generally accepted in the United States of America (U.S. GAAP) recognized by the FASB to be applied by nongovernmental entities, and all of the Codification’s content carries the same level of authority.
b. Cash
The Company considers all highly liquid investments with a maturity of three months or less at the time of purchase to be cash equivalents. At times such investments may be in excess of federal deposit insurance limits.
c. Trade Accounts Receivable
Trade accounts receivable are recorded net of the allowance for doubtful accounts. The Company provides for an allowance for doubtful collections that is based upon a review of outstanding receivables, historical collection information, and existing economic conditions. Balances still outstanding after the Company has used reasonable collection efforts are written off though a charge to the valuation allowance and a credit to trade accounts receivable. The allowance for doubtful accounts was $47,807 as of October 31, 2020 and 2019, respectively.
d. Property and Equipment
Property and equipment are stated at cost less accumulated depreciation. Expenditures for minor replacements, maintenance and repairs which do not increase the useful lives of the property and equipment are charged to operations as incurred. Major additions and improvements are capitalized. Depreciation and amortization are computed using the straight-line method over their estimated useful lives which is typically three to five years for equipment and 30 years for buildings.
| F-7 |
CODA OCTOPUS GROUP, INC.
Notes to the Consolidated Financial Statements
October 31, 2020 and 2019
NOTE 2 - SUMMARY OF ACCOUNTING POLICIES (Continued)
e. Advertising
Coda follows the policy of charging the costs of advertising to expense as incurred, which aggregated $4,884 and $18,271 for the years ended October, 31 2020 and 2019 respectively.
f. Inventory
Inventory is stated at the lower of cost (Weighted Average method) or net realizable value. Inventory consisted of the following components:
| October 31, 2020 | October 31, 2019 | |||||||
| Inventory | ||||||||
| Raw materials and parts | $ | 7,322,688 | $ | 4,379,260 | ||||
| Work in progress | 698,756 | 517,354 | ||||||
| Finished goods | 1,120,829 | 453,900 | ||||||
| Total Inventory | $ | 9,142,273 | $ | 5,350,514 | ||||
g. Estimates
The preparation of consolidated financial statements in conformity with U.S. GAAP requires management to make estimates and assumptions that affect the reported amounts of assets and liabilities and disclosure of contingent assets and liabilities at the date of the financial statements and the reported amounts of revenues including unbilled and deferred revenues and expenses during the reporting period. Actual results could differ from those estimates. Significant estimates include estimates related to the percentage of completion method used to account for contracts including costs and earnings in excess of billings, billings in excess of costs and estimated earnings and the valuation of goodwill.
h. Revenue Recognition
Beginning on November 1, 2018, the Company adopted the Financial Accounting Standards Board’s Topic 606, Revenue from Contracts with Customers (“Topic 606”). Previously, we had recognized revenue in accordance with FASB Topic 605, Revenue Recognition. After carefully comparing the old and the new revenue standards, we believe that our previous revenue recognition policy is substantially consistent with our new revenue recognition policy and that revenues are consistently stated between periods and no cumulative effect adjustment was required.
| F-8 |
CODA OCTOPUS GROUP, INC.
Notes to the Consolidated Financial Statements
October 31, 2020 and 2019
NOTE 2 – SUMMARY OF ACCOUNTING POLICIES (Continued)
h. Revenue Recognition (Continued)
Topic 606 has established a five-step process to determine the amount of revenue to record from contracts with customers. The five steps are:
| ● | Determine if we have a contract with a customer; | |
| ● | Determine the performance obligations in that contract; | |
| ● | Determine the transaction price; | |
| ● | Allocate the transaction price to the performance obligations; and | |
| ● | Determine when to recognize revenue. |
Our revenues are earned under formal contracts with our customers and are derived from both sales and rental of underwater technologies and equipment for real time 3D imaging, mapping, defense and survey applications and from the engineering services which we provide primarily to prime defense contractors. Our contracts do not include the possibility for additional contingent consideration so that our determination of the contract price does not involve having to consider potential additional variable consideration. Our sales do not include a right of return by the customer.
With regard to our Marine Technology Business (“Products Business”), all of our products are sold on a stand-alone basis and those market prices are evidence of the value of the products. To the extent that we also provide services (e.g., installation, training, post-sales technical support etc.), those services are either included as part of the product or are subject to written contracts based on the stand-alone value of those services. Revenue from the sale of services is recognized when those services have been provided to the customer and evidence of the provision of those services exist.
Revenue derived from either our subscription package offerings or rental of our equipment is recognized when performance obligations are met, in particular, on a daily basis during the subscription or rental period.
For arrangements with multiple performance obligations, we recognize product revenue by allocating the transaction revenue to each performance obligation based on the relative fair value of each deliverable and recognize revenue when performance obligations are met including when equipment is delivered, and for rental of equipment, when installation and other services are performed.
Our contracts sometimes require customer payments in advance of revenue recognition and are recognized as revenue when the Company has fulfilled its obligations under the respective contracts. Until such time, we recognize this prepayment as deferred revenue.
For software license sales for which any services rendered are not considered distinct to the functionality of the software, we recognize revenue upon delivery of the software.
| F-9 |
CODA OCTOPUS GROUP, INC.
Notes to the Consolidated Financial Statements
October 31, 2020 and 2019
NOTE 2 – SUMMARY OF ACCOUNTING POLICIES (Continued)
h. Revenue Recognition (Continued)
With respect to revenues related to our Services Business, there are contracts in place that specify the fixed hourly rate and other reimbursable costs to be billed based on material and direct labor hours incurred and, revenue is recognized on these contracts based on material and the direct labor hours incurred. Revenues from fixed-price contracts are recognized on the percentage-of-completion method, measured by the percentage of costs incurred (materials and direct labor hours) to date to estimated total services (materials and direct labor hours) for each contract. This method is used as we consider expenditures for direct materials and labor hours to be the best available measure of progress on these contracts.
On a quarterly basis, we examine all of our fixed-price contracts to determine if there are any losses to be recognized during the period. Any such loss is recorded in the quarter in which the loss first becomes apparent based upon costs incurred to date and the estimated costs to complete as determined by experience from similar contracts. Variations from estimated contract performance could result in adjustments to operating results.
Recoverability of Deferred Costs
In accordance with Topic 606, we defer costs on projects for service revenue. Deferred costs consist primarily of incremental direct costs to customize and install systems, as defined in individual customer contracts, including costs to acquire hardware and software from third parties and payroll costs for our employees and other third parties. The pricing of these service contracts is intended to provide for the recovery of these types of deferred costs over the life of the contract.
We recognize such costs in accordance with our revenue recognition policy by contract. For revenue recognized under the percentage of completion method, costs are recognized as products are delivered or services are provided in accordance with the percentage of completion calculation. For revenue recognized over time, costs are recognized ratably over the term of the contract, commencing on the date of revenue recognition. At each quarterly balance sheet date, we review deferred costs, to ensure they are ultimately recoverable.
Any anticipated losses on uncompleted contracts are recognized when evidence indicates the estimated total cost of a contract exceeds its estimated total revenue.
Deferred Commissions
Our incremental direct costs of obtaining a contract, which consists of sales commissions are deferred and amortized over the period of the contract performance. We classify deferred commissions as current or noncurrent based on the timing of when we expect to recognize the expense. The current and noncurrent portions of deferred commissions are included in prepaid expenses and other current assets, and other assets, net, respectively, in our consolidated balance sheets. As of October 31, 2020 and 2019, we had deferred commissions of $3,884 and $68,175, respectively. Amortization expense related to deferred commissions was $125,284 and $127,590 in the years ended October 31, 2020 and 2019, respectively.
| F-10 |
CODA OCTOPUS GROUP, INC.
Notes to the Consolidated Financial Statements
October 31, 2020 and 2019
NOTE 2 – SUMMARY OF ACCOUNTING POLICIES (Continued)
h. Revenue Recognition (Continued)
Other Revenue Disclosures
See Note 12 – Segment Analysis for a breakdown of revenues from external customers and cost of those revenues between our Product Segment and Services Segment including information on the split of revenues by geography.
i. Concentrations of Risk
Credit losses, if any, have been provided for in the consolidated financial statements and are based on management’s expectations. The Company’s accounts receivables are subject to potential concentrations of credit risk, since a significant part of the Company’s sales are to a small number of companies and, even though these are generally established businesses, market fluctuations such as the price of oil may affect our customers’ ability to meet their obligations to us. Furthermore, Trade disputes may result in impairment or delays in receivables.
The Company’s bank deposits are held with financial institutions both in and outside the USA. At times, such amounts may be in excess of applicable government mandated insurance limits. The Company has not experienced any losses in such accounts or lack of access to its cash, and believes it is not exposed to significant risk of loss with respect to cash.
j. Contracts in Progress (Unbilled Receivables and Deferred Revenue)
Costs and estimated earnings in excess of billings on uncompleted contracts represent accumulated project expenses and fees which have not been invoiced to customers as of the date of the balance sheet. These amounts are stated on the consolidated balance sheets as Unbilled Receivables of $861,300 and $2,279,362 as of October 31, 2020 and 2019, respectively.
Our Deferred Revenue of $989,588 and $973,735 as of October 31, 2020 and 2019, respectively, consists of billings in excess of costs and revenues received as part of our warranty obligations upon completing a sale, as elaborated further in the last paragraph of this note.
Revenue received as part of sales of equipment includes a provision for warranty and is treated as deferred revenue, along with extended warranty sales, which may be purchased by customers. These amounts are amortized over the relevant warranty period (12 months is our standard warranty or 24, 36 or 60 months for extended warranty) from the date of sale. These amounts are stated on the consolidated balance sheets as a component of Deferred Revenue and were $211,888 and $497,819 as of October 31, 2020 and 2019, respectively.
| F-11 |
CODA OCTOPUS GROUP, INC.
Notes to the Consolidated Financial Statements
October 31, 2020 and 2019
NOTE 2 - SUMMARY OF ACCOUNTING POLICIES (CONTINUED)
k. Income Taxes
The Company accounts for income taxes in accordance with Accounting Standards Codification 740, Income Taxes (ASC 740). Under ASC 740, deferred income tax assets and liabilities are recorded for the income tax effects of differences between the bases of assets and liabilities for financial reporting purposes and their bases for income tax reporting. The Company’s differences arise principally from the use of various accelerated and modified accelerated cost recovery systems for income tax purposes versus straight line depreciation used for book purposes and from the utilization of net operating loss carry-forwards.
Deferred tax assets and liabilities are the amounts by which the Company’s future income taxes are expected to be impacted by these differences as they reverse. Deferred tax assets are based on differences that are expected to decrease future income taxes as they reverse. Correspondingly, deferred tax liabilities are based on differences that are expected to increase future income taxes as they reverse. Note 7 below discusses the amounts of deferred tax assets and liabilities, and also presents the impact of significant differences between financial reporting income and taxable income.
For income tax purposes, the Company uses the percentage of completion method of recognizing revenues on long-term contracts which is consistent with the Company’s financial reporting under U.S. GAAP.
l. Goodwill and Intangible Assets
Goodwill and Intangible assets consist principally of the excess of cost over the fair value of net assets acquired (or goodwill), customer relationships, non-compete agreements and licenses. Goodwill was allocated to our reporting units based on the original purchase price allocation. Goodwill is not amortized and is evaluated for impairment annually or more often if circumstances indicate impairment may exist. Customer relationships, non-compete agreements, patents and licenses are being amortized on a straight-line basis over periods of 2 to 15 years. The Company amortizes its limited life goodwill and intangible assets using the straight-line method over their estimated period of benefit. We periodically evaluate the recoverability of goodwill and intangible assets and take into account events or circumstances that warrant revised estimates of useful lives or that indicate that impairment exists.
Step 1 of the goodwill impairment test, used to identify potential impairment, compares the fair value of the reporting unit with its carrying amount, including goodwill. If the fair value, which is based on future cash flows, exceeds the carrying amount, goodwill is not considered impaired. If the carrying amount exceeds the fair value, the Step 2 must be performed to measure the amount of the impairment loss, if any. The Company has adopted Accounting Standards Codification 2017 – 04, simplifying the Test for Goodwill Impairment, which permits the Company to impair the difference between carrying amounts in excess of the fair value of the reporting unit as the reduction in goodwill. ASC 2017-04 eliminates the requirement in previous GAAP to perform Step 2 of the goodwill impairment test.
At the end of each year, we evaluate goodwill on a separate reporting unit basis to assess recoverability, and impairments, if any, are recognized in earnings. An impairment loss would be recognized in an amount equal to the excess of the carrying amount of the reporting unit over the fair value of the reporting unit.
There were no impairment charges recognized during the years ended October 31, 2020 and 2019.
| F-12 |
CODA OCTOPUS GROUP, INC.
Notes to the Consolidated Financial Statements
October 31, 2020 and 2019
NOTE 2 - SUMMARY OF ACCOUNTING POLICIES (Continued)
m. Fair Value of Financial Instruments
The Company’s financial instruments include cash, accounts receivable, accounts payable, accrued expenses and notes payable. The carrying amounts of cash, accounts receivable, accounts payable and accrued expenses approximate fair values because of the short-term nature of these instruments. The aggregate carrying amount of the notes payable approximates fair value as they bear interest at a market interest rate based on their term and maturity.
The fair value of the Company’s long-term debt approximates its carrying amount based on the fact that the Company believes it could obtain similar terms and conditions for similar debt.
n. Foreign Currency Translation
Assets and liabilities are translated at the prevailing exchange rates at the balance sheet dates. Related revenues and expenses are translated at weighted average exchange rates in effect during the period. Stockholders’ equity, fixed assets and long-term investments are recorded at historical exchange rates. Resulting translation adjustments are recorded as a separate component in stockholders’ equity as part of accumulated other comprehensive income or (loss) as may be appropriate. Foreign currency transaction gains and losses are included in the consolidated statements of income and comprehensive income.
o. Long-Lived Assets
Long-lived assets to be held and used are reviewed for impairment whenever events or changes in circumstances indicate that the carrying amount of an asset may not be recoverable. The carrying amount of a long-lived asset is not recoverable if its carrying amount exceeds the sum of the undiscounted cash flows expected to result from the use and eventual disposal of the asset. Long-lived assets to be disposed of are reported at the lower of carrying amount or fair value less cost to sell. No impairment loss was recognized during the years ended October 31, 2020 and 2019, respectively.
p. Research and Development
Research and development costs consist of expenditures for the development of present and future patents and technology, which are not capitalizable. Under current legislation, we are eligible for UK tax credits related to our qualified research and development expenditures.
Tax credits are classified as a reduction of research and development expense. During the years ended October 31, 2020 and 2019, we had $0 and $0, respectively.
q. Stock Based Compensation
In accordance with the accounting rules for stock compensation, for time based awards, the Company is accruing a stock compensation expense and increase to additional paid in capital based on the market value of the common stock as of the grant date throughout the vesting period. The vesting period for the awards is three years and is based on the employee’s continuous service to the Company. Prior to vesting, the awards are subject to forfeiture in whole or in part under certain circumstances. We use the Black-Scholes method for equity instruments granted to employees.
| F-13 |
CODA OCTOPUS GROUP, INC.
Notes to the Consolidated Financial Statements
October 31, 2020 and 2019
NOTE 2 - SUMMARY OF ACCOUNTING POLICIES (Continued)
r. Comprehensive Income
Comprehensive income is defined to include all changes in equity except those resulting from investments by owners and distributions to owners. Comprehensive income includes gains and losses on foreign currency translation adjustments and is included as a component of stockholders’ equity.
s. Earnings per Share
We compute basic earnings per share by dividing the income attributable to common shareholders by the weighted average number of common shares outstanding in the reporting period.
Following is a reconciliation of earnings from continuing operations and weighted average common shares outstanding for purposes of calculating basic and diluted earnings per share:
| Year | Year | |||||||
| Ended | Ended | |||||||
| October 31, | October 31, | |||||||
| Fiscal Period | 2020 | 2019 | ||||||
| Numerator: | ||||||||
| Net Income (Loss) | $ | 3,343,585 | $ | 5,225,199 | ||||
| Denominator: | ||||||||
| Basic weighted average common shares outstanding | 10,733,799 | 10,680,007 | ||||||
| Options issued | 561,000 | - | ||||||
| Diluted outstanding shares | 11,294,799 | 10,680,007 | ||||||
| Earnings (Loss) from continuing operations | ||||||||
| Basic | $ | 0.31 | $ | 0.49 | ||||
| Diluted | $ | 0.30 | $ | 0.49 | ||||
t. Reclassification of Prior Year Presentation
Certain prior year amounts have been reclassified for consistency with the current year presentation. These reclassifications had no effect on the reported results of operations. An adjustment has been made to the Consolidated Balance Sheet and Consolidated Statements of Cash Flows for the fiscal year ended October 31, 2019, to reclassify the Value Added Tax (VAT) receivable.
u. Recent Accounting Pronouncements
There have been no new accounting pronouncements not yet effective that have significance, or potential significance, to our Consolidated Financial Statements.
| F-14 |
CODA OCTOPUS GROUP, INC.
Notes to the Consolidated Financial Statements
October 31, 2020 and 2019
NOTE 3 – GOODWILL AND INTANGIBLE ASSETS
Goodwill and Other Intangible Assets are evaluated on an annual basis. If there is reason to believe that their values have been diminished or impaired, those write-downs will be included in results from operations.
The identifiable goodwill and intangible assets acquired and their carrying value as of October 31, 2020 and 2019, are as follows:
Amortization of patents, customer relationships, non-compete agreements and licenses included as a charge to income amounted to $44,642 and $39,689 for the years ended October 31, 2020 and 2019, respectively. Goodwill is not being amortized.
| October 31, 2020 | October 31, 2019 | |||||||
| Customer relationships (weighted average life of 10 years) | $ | 720,592 | $ | 720,592 | ||||
| Non-compete agreements (weighted average life of 3 years) | 198,911 | 198,911 | ||||||
| Patents and other (weighted average life of 10 years) | 472,173 | 381,785 | ||||||
| Total identifiable intangible assets - gross carrying value | 1,391,676 | 1,301,288 | ||||||
| Less: accumulated amortization | (1,042,332 | ) | (1,070,505 | ) | ||||
| Total intangible assets, net | $ | 349,344 | $ | 230,783 | ||||
Future estimated annual amortization expenses as of October 31, 2020 as follows:
| Years Ending October 31, | Amount | |||
| 2021 | 46,338 | |||
| 2022 | 46,317 | |||
| 2023 | 43,978 | |||
| 2024 | 33,000 | |||
| 2025 | 19,409 | |||
| Thereafter | 160,302 | |||
| Totals | $ | 349,344 | ||
| F-15 |
CODA OCTOPUS GROUP, INC.
Notes to the Consolidated Financial Statements
October 31, 2020 and 2019
NOTE 3 – GOODWILL AND INTANGIBLE ASSETS (Continued)
As a result of the acquisitions of Coda Octopus Martech, Ltd., Coda Octopus Colmek, Inc. and Coda Octopus Products, Ltd., the Company has goodwill in the amount of $3,382,108 as of October 31, 2020 and 2019, respectively. We enlisted the assistance of an independent valuation consultant to determine the values of our goodwill and intangible assets at the dates of acquisition and by management for the dates thereafter. The carrying amount of goodwill as of October 31, 2020 and 2019, respectively, are recorded below:
| October 31, 2020 | October 31, 2019 | |||||||
| Breakout of Goodwill: | ||||||||
| Coda Octopus Colmek, Inc. | $ | 2,038,669 | $ | 2,038,669 | ||||
| Coda Octopus Products, Ltd | 62,315 | 62,315 | ||||||
| Coda Octopus Martech, Ltd | 1,281,124 | 1,281,124 | ||||||
| Total Goodwill | $ | 3,382,108 | $ | 3,382,108 | ||||
Considerable management judgment is necessary to estimate the fair value of goodwill. Based on various market factors and projections used by management, actual results could vary significantly from management’s estimates.
The Company’s policy is to test its goodwill balances for impairment on an annual basis, in the fourth quarter of each year, or more frequently if events or changes in circumstances indicate that the asset might be impaired.
Based on these evaluations, the fair value of reporting unit exceeds its carrying value. As such no impairment was recorded by management.
| F-16 |
CODA OCTOPUS GROUP, INC.
Notes to the Consolidated Financial Statements
October 31, 2020 and 2019
NOTE 4 – PROPERTY AND EQUIPMENT
Property and equipment consisted of the following as of:
| October 31, 2020 | October 31, 2019 | |||||||
| Buildings | $ | 5,103,324 | $ | 4,654,029 | ||||
| Land | 200,000 | 200,000 | ||||||
| Office machinery and equipment | 2,044,405 | 1,954,938 | ||||||
| Rental Assets | 1,531,351 | 1,468,124 | ||||||
| Furniture, fixtures and improvements | 1,187,927 | 1,158,033 | ||||||
| Totals | 10,067,007 | 9,435,124 | ||||||
| Less: accumulated depreciation | (4,007,107 | ) | (3,448,312 | ) | ||||
| Property and Equipment – Net | $ | 6,059,900 | $ | 5,986,812 | ||||
Depreciation expense for the years ended October 31, 2020 and 2019 was $758,297 and $794,086 respectively.
We own substantially all of our facilities and believe that the effect of adopting the FASB’s lease accounting standard has been immaterial.
NOTE 5 - OTHER CURRENT ASSETS
Other current assets consisted of the following at:
| October 31, 2020 | October 31, 2019 | |||||||
| Other Current Assets | ||||||||
| Deposits | $ | 112,984 | $ | 42,932 | ||||
| Tax receivables | 131,187 | 255,255 | ||||||
| Total Other Current Assets | $ | 244,171 | $ | 298,187 | ||||
| F-17 |
CODA OCTOPUS GROUP, INC.
Notes to the Consolidated Financial Statements
October 31, 2020 and 2019
NOTE 6 – CAPITAL STOCK
Common Stock
On November 16, 2018, the Company issued 23,965 shares to one investor pursuant to their pre-emption rights under the terms of the private placement effected on or around January 29, 2018 for a purchase price of $105,446.
On February 3, 2019, the Company issued a total of 7,143 shares to one of its directors for services rendered. These shares had a fair value of $42,289.
On June 24, 2019, the Company issued 20,000 shares of common stock to consultants for services rendered. These shares had a fair value of $291,800.
On September 16, 2019, the Company issued 25,000 shares of common stock pursuant to the terms of the Company’s Stock Incentive Plan 2017 to a director of one of our foreign subsidiaries for services rendered. These shares had a fair value of $260,500.
On September 16, 2019, the Company issued a total of 5,357 of common stock pursuant to the terms of the Company’s Stock Incentive Plan 2017 to one of its employees for services rendered. These shares had a fair value of $55,820.
On June 9, 2020, the Company issued 30,000 shares of common stock to consultants for services rendered. These shares had a fair value of $169,500.
During the fiscal year ended October 31, 2020, the Company granted options to purchase an aggregate of 561,000 shares of common stock pursuant to the terms of the Plan to various eligible individuals. As a result, as of October 31, 2020, there were 352,612 shares available under the Plan.
The following table presents stock option activity for the years ended October 31, 2020 and 2019.
| Stock Options | ||||||||||||||||||||||||
| Total | Weighted Average Exercise Price | Exercisable | Weighted Average Exercise Price | Non-Vested | Weighted Average Exercise Price | |||||||||||||||||||
| Outstanding at October 31, 2018 | - | $ | - | - | $ | - | - | $ | - | |||||||||||||||
| Granted | - | - | - | - | - | - | ||||||||||||||||||
| Vested | - | - | - | - | - | - | ||||||||||||||||||
| Exercises | - | - | - | - | - | - | ||||||||||||||||||
| Forfeited or cancelled | - | - | - | - | - | - | ||||||||||||||||||
| Outstanding at October 31, 2019 | - | $ | - | - | $ | - | - | $ | - | |||||||||||||||
| Granted | 564,000 | $ | 4.65 | - | - | 564,000 | $ | 4.65 | ||||||||||||||||
| Vested | - | - | - | - | - | - | ||||||||||||||||||
| Exercises | - | - | - | - | - | - | ||||||||||||||||||
| Forfeited or cancelled | (3,000 | ) | $ | 4.65 | - | - | (3,000 | ) | $ | 4.65 | ||||||||||||||
| Outstanding at October 31, 2020 | 561,000 | $ | 4.65 | - | - | 561,000 | $ | 4.65 | ||||||||||||||||
| Aggregate Intrinsic Value | ||||||||||||||||||||||||
| October 31, 2019 | $ | - | $ | - | $ | - | ||||||||||||||||||
| Aggregate Intrinsic Value | ||||||||||||||||||||||||
| October 31, 2020 | $ | 491,280 | $ | - | $ | - | ||||||||||||||||||
The intrinsic value as of October 31, 2020 was $491,280 and $0 for October 31, 2019.
The total expense recognized by the Company during the year ended October 31, 2020 was $441,280. The expense in future years is $815,880.
Preferred Stock
Series A and Series C Preferred Stock
The Company is authorized to issue 5,000,000 shares of preferred stock with a par value of $0.001 per share. We had previously designated 50,000 preferred shares as Series A preferred stock and 50,000 preferred shares as Series C preferred stock. Both series have since been eliminated and as of October 31, 2020 there were no Series A or Series C Preferred Stock issued or outstanding.
| F-18 |
CODA OCTOPUS GROUP, INC.
Notes to the Consolidated Financial Statements
October 31, 2020 and 2019
NOTE 7 - INCOME TAXES
The Company provides for income taxes and the related accounts under the asset and liability method. Deferred tax assets and liabilities are determined based on the difference between the financial statement and tax bases of assets and liabilities using enacted tax rates expected to be in effect during the year in which the basis differences reverse. Valuation allowances are established when management determines it is more likely than not that some portion, or all, of the deferred tax assets will not be realized.
The provision (benefit) for income taxes comprises:
| October 31, 2020 | October 31, 2019 | |||||||
| Current federal benefit | $ | (12,502 | ) | $ | (75,004 | ) | ||
| Foreign tax (benefit) expense | (38,161 | ) | 35,582 | |||||
| Total Current Tax Benefit | (50,663 | ) | (39,422 | ) | ||||
| Deferred federal expense | 305,125 | 1,046,776 | ||||||
| Deferred foreign benefit | (196,240 | ) | - | |||||
| Deferred Tax Expense | 108,885 | 1,046,776 | ||||||
| Total Income Tax Expense | $ | 58,222 | $ | 1,007,354 | ||||
The expense for income taxes differed from the U.S. statutory rate due to the following:
| October 31, 2020 | October 31, 2019 | |||||||
| Statutory tax rate | 21.0 | % | 21.0 | % | ||||
| Change in deferred taxes | (17.1 | )% | (4.2 | )% | ||||
| Alternative Minimum Tax (refund) | (1.1 | )% | (1.2 | )% | ||||
| Foreign tax expense | (1.1 | )% | 0.5 | % | ||||
| Total | 1.7 | % | 16.1 | % | ||||
Deferred income taxes reflect the net tax effects of temporary differences between the carrying amounts of assets and liabilities for financial reporting purposes and the amounts used for income tax purposes.
Significant components of the Company’s deferred tax assets and liabilities are as follows:
| October 31, 2020 | October 31, 2019 | |||||||
| Noncurrent deferred tax assets | ||||||||
| U.S. NOL carryforwards | $ | 272,993 | $ | 670,787 | ||||
| Other | - | (39,103 | ) | |||||
| Stock option compensation | 92,669 | - | ||||||
| Foreign R&D refunds | 196,240 | - | ||||||
| Total | $ | 561,902 | $ | 631,684 | ||||
As of October 31, 2020, we had U.S. federal net operating loss (NOL) carryforwards of $1,299,969, which expire in 2029.
| F-19 |
CODA OCTOPUS GROUP, INC.
Notes to the Consolidated Financial Statements
October 31, 2020 and 2019
NOTE 8 - NOTES PAYABLE
Notes payable consisted of the following at:
| October 31, 2020 | October 31, 2019 | |||||||
| Secured
note payable to HSBC NA with interest payable on the 28th day of each month at 4.56% per annum. Our monthly repayment
obligation under this loan is $43,777 (comprising both principal and interest repayment). The maturity of this Loan is
December 28, 2021 | $ | 573,108 | $ | 1,059,574 | ||||
| Total | 573,108 | 1,059,574 | ||||||
| Less: current portion | (509,769 | ) | (487,140 | ) | ||||
| Total Long Term Notes Payable | $ | 63,339 | $ | 572,434 | ||||
| Years Ending October 31, | Amount | |||
| 2021 | 509,769 | |||
| 2022 | 63,339 | |||
| Totals | $ | 573,108 | ||
The HSBC loan is secured by a blanket lien on all of the Company’s US subsidiaries. The foreign subsidiaries are each guarantors of the obligations undertaken in the loan agreement.
The Company concluded a $4,000,000 revolving line of credit facility with HSBC NA on November 27, 2019, with the interest rate established as the applicable prime rate. The outstanding balance on the line of credit was $0 as of October 31, 2020. This revolving credit line which is subject to renewal will expire on November 26, 2021.
| F-20 |
CODA OCTOPUS GROUP, INC.
Notes to the Consolidated Financial Statements
October 31, 2020 and 2019
NOTE 9 - ACCUMULATED OTHER COMPREHENSIVE INCOME (LOSS)
Other comprehensive income (loss) consists of foreign currency translation adjustments. Total other comprehensive income (loss) was ($185,870) and $93,255 for the years ended October 31, 2020 and 2019, respectively.
A reconciliation of the other comprehensive income (loss) in the stockholders’ equity section of the consolidated balance sheets is as follows:
| October 31, 2020 | October 31, 2019 | |||||||
| Balance, beginning of year | $ | (2,135,408 | ) | $ | (2,228,663 | ) | ||
| Total other comprehensive income for the year - foreign currency translation adjustment | (185,870 | ) | 93,255 | |||||
| Balance, end of period | $ | (2,321,278 | ) | $ | (2,135,408 | ) | ||
NOTE 10 – CONCENTRATIONS
Significant Customers
During the year ended October 31, 2020, the Company had one customer from whom it generated sales greater than 10% of net revenues. Revenue from this customer was $4,273,702, or 21% of net revenues during the period. Total accounts receivable from this customer at October 31, 2020 was $214,747 or 11% of accounts receivable.
During the year ended October 31, 2019, the Company had one customer from whom it generated sales greater than 10% of net revenues. Revenue from this customer was $6,764,199, or 27% of net revenues during the year. Total accounts receivable from this customer at October 31, 2019 was $898,584 or 20% of accounts receivable.
NOTE 11 - EMPLOYEE BENEFIT PLANS
The Company’s U.S. subsidiaries maintain a 401(k) retirement plan. The plan allows the Company to make matching contributions of 4% of employee compensation, subject to IRS contribution limits. U.S. employees who have at least six months of service with the Company are eligible. In addition, the Company’s UK subsidiaries operate statutory pension schemes which provide for the payment of certain contribution by the Company and the Employee. These schemes in the UK operate on a defined contribution money purchase basis and the contributions are charged to operations as they arise. Finally, the Company is obligated to provide pension funding according the laws in which it operates including in both Denmark and Australia. The Company has an arrangement that fulfills this requirement. Employee benefit costs for the years ended October 31, 2020 and 2019 were $140,271 and $59,927, respectively.
| F-21 |
CODA OCTOPUS GROUP, INC.
Notes to the Consolidated Financial Statements
October 31, 2020 and 2019
NOTE 12 -SEGMENT ANALYSIS
Based on the fundamental difference in the types of offering products versus services, we operate two distinct reportable segments which are managed separately. Coda Octopus Products (“Marine Technology Business” or “Products Segment”) operations are comprised primarily of sale of underwater technology sonar solutions, products for underwater operations including hardware and software; and rental of solutions and products to the underwater market. Coda Octopus Martech and Coda Octopus Colmek (“Marine Engineering Business” or “Services Segment”) provides engineering services primarily as sub-contractors to prime defense contractors.
Segment operating income is total segment revenue reduced by operating expenses identifiable with the business segment. Corporate includes general corporate administrative costs (“Overhead”).
The Company evaluates performance and allocates resources based upon segment operating income. The accounting policies of the reportable segments are the same as those described in the summary of accounting policies.
There are inter-segment sales which have been eliminated in our financial statements but are disclosed in the tables below for information purposes.
The following table summarizes segment asset and operating balances by reportable segment as of and for the years ended October 31, 2020 and 2019, respectively.
The Company’s reportable business segments sell their goods and services in four geographic locations:
| ● | Americas |
| ● | Europe |
| ● | Australia/Asia |
| ● | Middle East/Africa |
| F-22 |
CODA OCTOPUS GROUP, INC.
Notes to the Consolidated Financial Statements
October 31, 2020 and 2019
NOTE 12 -SEGMENT ANALYSIS (Continued)
| Marine Technology Business (Products) | Marine Engineering Business (Services) | Overhead | Total | |||||||||||||
| Year Ended October 31, 2020 | ||||||||||||||||
| Revenues from External Customers | $ | 11,278,181 | $ | 8,765,629 | $ | - | $ | 20,043,810 | ||||||||
| Cost of Revenues | 2,254,008 | 5,060,354 | - | 7,314,362 | ||||||||||||
| Gross Profit | 9,024,173 | 3,705,275 | - | 12,729,448 | ||||||||||||
| Research & Development | 1,955,364 | 1,042,243 | 190,782 | 3,188,389 | ||||||||||||
| Selling, General & Administrative | 2,779,662 | 2,260,849 | 1,696,783 | 6,737,294 | ||||||||||||
| Total Operating Expenses | 4,735,026 | 3,303,092 | 1,887,565 | 9,925,683 | ||||||||||||
| Income (Loss) from Operations | 4,289,147 | 402,183 | (1,887,565 | ) | 2,803,765 | |||||||||||
| Other Income (Expense) | ||||||||||||||||
| Other Income | 19,184 | 190 | - | 19,374 | ||||||||||||
| Funding from Paycheck Protection Program | 122,327 |
526,544 |
- |
648,871 |
||||||||||||
| Interest (Expense) | (10,612 | ) | (15,672 | ) | (43,919 | ) | (70,203 | ) | ||||||||
| Total Other Income (Expense) | 130,899 | 511,062 | (43,919 | ) | 598,042 | |||||||||||
| Net Income (Loss) before Income Taxes | 4,420,046 | 913,245 | (1,931,484 | ) | 3,401,807 | |||||||||||
| Income Tax Benefit (Expense) | ||||||||||||||||
| Current Tax Benefit (Expense) | 63,590 | - | (12,927 | ) | 50,663 | |||||||||||
| Deferred Tax (Expense) Benefit | (196,664 | ) | 273,666 | (185,887 | ) | (108,885 | ) | |||||||||
| Total Income Tax (Expense) Benefit | (133,074 | ) | 273,666 | (198,814 | ) | (58,222 | ) | |||||||||
| Net Income (Loss) | $ | 4,286,972 | $ | 1,186,911 | $ | (2,130,298 | ) | $ | 3,343,585 | |||||||
| Supplemental Disclosures | ||||||||||||||||
| Total Assets | $ | 22,200,123 | $ | 14,347,827 | $ | 1,491,201 | $ | 38,039,151 | ||||||||
| Total Liabilities | $ | 1,572,314 | $ | 1,321,011 | $ | 749,558 | $ | 3,642,883 | ||||||||
| Revenues from Intercompany Sales - eliminated from sales above | $ | 997,150 | $ | 354,373 | $ | 2,700,000 | $ | 4,051,523 | ||||||||
| Depreciation and Amortization | $ | 678,449 | $ | 105,775 | $ | 22,462 | $ | 806,686 | ||||||||
| Purchases of Long-lived Assets | $ | 811,352 | $ | 19,660 | $ | 167,323 | $ | 998,335 | ||||||||
| F-23 |
CODA OCTOPUS GROUP, INC.
Notes to the Consolidated Financial Statements
October 31, 2020 and 2019
NOTE 12 -SEGMENT ANALYSIS (Continued)
| Marine Technology Business (Products) | Marine Engineering Business (Services) | Overhead | Total | |||||||||||||
| Year Ended October 31, 2019 | ||||||||||||||||
| Revenues from External Customers | $ | 12,908,110 | $ | 12,148,824 | $ | - | $ | 25,056,934 | ||||||||
| Cost of Revenues | 2,519,768 | 6,107,847 | - | 8,627,615 | ||||||||||||
| Gross Profit | 10,388,342 | 6,040,977 | - | 16,429,319 | ||||||||||||
| Research & Development | 2,208,749 | 146,061 | 446,521 | 2,801,331 | ||||||||||||
| Selling, General & Administrative | 3,080,134 | 2,492,410 | 1,802,007 | 7,374,551 | ||||||||||||
| Total Operating Expenses | 5,288,883 | 2,638,471 | 2,248,528 | 10,175,882 | ||||||||||||
| Income (Loss) from Operations | 5,099,459 | 3,402,506 | (2,248,528 | ) | 6,253,437 | |||||||||||
| Other Income (Expense) | ||||||||||||||||
| Other Income | 70,186 | 26 | - | 70,212 | ||||||||||||
| Interest Expense | (10,564 | ) | (14,820 | ) | (65,712 | ) | (91,096 | ) | ||||||||
| Total Other Income (Expense) | 59,622 | (14,794 | ) | (65,712 | ) | (20,884 | ) | |||||||||
| Net Income (Loss) before Income Taxes | 5,159,081 | 3,387,712 | (2,314,240 | ) | 6,232,553 | |||||||||||
| Current Tax Benefit | (9,391 | ) | 33,454 | 15,359 | 39,422 | |||||||||||
| Deferred Tax (Expense) | (336,101 | ) | (496,318 | ) | (214,357 | ) | (1,046,776 | ) | ||||||||
| Total Income Tax Expense | (345,492 | ) | (462,864 | ) | (198,998 | ) | (1,007,354 | ) | ||||||||
| Net Income (Loss) | $ | 4,813,589 | $ | 2,924,848 | $ | (2,513,238 | ) | $ | 5,225,199 | |||||||
| Supplemental Disclosures | ||||||||||||||||
| Total Assets | $ | 19,386,652 | $ | 14,165,120 | $ | 959,472 | $ | 34,511,244 | ||||||||
| Total Liabilities | $ | 1,753,823 | $ | 962,641 | $ | 1,167,007 | $ | 3,883,471 | ||||||||
| Revenues from Intercompany Sales - eliminated from sales above | $ | 1,590,548 | $ | 145,150 | $ | 2,700,000 | $ | 4,435,698 | ||||||||
| Depreciation and Amortization | $ | 581,942 | $ | 236,092 | $ | 15,741 | $ | 833,775 | ||||||||
| Purchases of Long-lived Assets | $ | 2,183,009 | $ | 81,446 | $ | 37,180 | $ | 2,301,635 | ||||||||
| F-24 |
CODA OCTOPUS GROUP, INC.
Notes to the Consolidated Financial Statements
October 31, 2020 and 2019
NOTE 12 -SEGMENT ANALYSIS (Continued)
| For the Year Ended October 31, 2020 | ||||||||||||
| Marine | Marine | |||||||||||
| Technology | Engineering | Grand | ||||||||||
| Business | Business | Total | ||||||||||
| Disaggregation of Total Net Sales | ||||||||||||
| Americas | ||||||||||||
| Equipment Sales | $ | 1,368,113 | $ | - | $ | 1,368,113 | ||||||
| Equipment Rentals | 175,282 | - | 175,282 | |||||||||
| Software Sales | 35,635 | - | 35,635 | |||||||||
| Engineering Parts | - | 4,546,391 | 4,546,391 | |||||||||
| Services | 1,422,830 | 1,230,283 | 2,653,113 | |||||||||
| Europe | ||||||||||||
| Equipment Sales | 583,006 | 230,060 | 813,066 | |||||||||
| Equipment Rentals | 697,638 | - | 697,638 | |||||||||
| Software Sales | 113,860 | - | 113,860 | |||||||||
| Engineering Parts | - | 2,753,488 | 2,753,488 | |||||||||
| Services | 485,954 | 5,407 | 491,361 | |||||||||
| Australia/Asia | ||||||||||||
| Equipment Sales | 5,165,905 | - | 5,165,905 | |||||||||
| Equipment Rentals | 487,639 | - | 487,639 | |||||||||
| Software Sales | 304,143 | - | 304,143 | |||||||||
| Services | 297,823 | - | 297,823 | |||||||||
| Middle East & Africa | ||||||||||||
| Equipment Sales | 66,556 | - | 66,556 | |||||||||
| Equipment Rentals | 592 | - | 592 | |||||||||
| Software Sales | - | - | - | |||||||||
| Services | 73,205 | - | 73,205 | |||||||||
| Total Net Sales | $ | 11,278,181 | $ | 8,765,629 | $ | 20,043,810 | ||||||
| For the Year Ended October 31, 2020 | ||||||||||||
| Marine | Marine | |||||||||||
| Technology | Engineering | Grand | ||||||||||
| Business | Business | Total | ||||||||||
| Total Net Sales by Geographic Area | ||||||||||||
| Americas | $ | 3,001,860 | $ | 5,776,674 | $ | 8,778,534 | ||||||
| Europe | 1,880,458 | 2,988,955 | 4,869,413 | |||||||||
| Australia/Asia | 6,255,510 | - | 6,255,510 | |||||||||
| Middle East & Africa | 140,353 | - | 140,353 | |||||||||
| Total Net Sales | $ | 11,278,181 | $ | 8,765,629 | $ | 20,043,810 | ||||||
| F-25 |
CODA OCTOPUS GROUP, INC.
Notes to the Consolidated Financial Statements
October 31, 2020 and 2019
NOTE 12 -SEGMENT ANALYSIS (Continued)
| For the Year Ended October 31, 2020 | ||||||||||||
| Marine | Marine | |||||||||||
| Technology | Engineering | Grand | ||||||||||
| Business | Business | Total | ||||||||||
| Total Net Sales by Product Line | ||||||||||||
| Equipment Sales | $ | 7,183,580 | $ | 230,060 | $ | 7,413,640 | ||||||
| Equipment Rentals | 1,361,151 | - | 1,361,151 | |||||||||
| Software Sales | 453,638 | - | 453,638 | |||||||||
| Engineering Parts | - | 7,299,879 | 7,299,879 | |||||||||
| Services | 2,279,812 | 1,235,690 | 3,515,502 | |||||||||
| Total Net Sales | $ | 11,278,181 | $ | 8,765,629 | $ | 20,043,810 | ||||||
| For the Year Ended October 31, 2019 | ||||||||||||
| Marine | Marine | |||||||||||
| Technology | Engineering | Grand | ||||||||||
| Business | Business | Total | ||||||||||
| Disaggregation of Total Net Sales | ||||||||||||
| Americas | ||||||||||||
| Equipment Sales | $ | 744,604 | $ | 57,497 | $ | 802,101 | ||||||
| Equipment Rentals | 639,055 | - | 639,055 | |||||||||
| Software Sales | 53,540 | - | 53,540 | |||||||||
| Engineering Parts | - | 9,117,338 | 9,117,338 | |||||||||
| Services | 1,187,873 | 1,744,577 | 2,932,450 | |||||||||
| Europe | ||||||||||||
| Equipment Sales | 1,626,052 | 145,933 | 1,771,985 | |||||||||
| Equipment Rentals | 1,137,244 | - | 1,137,244 | |||||||||
| Software Sales | 167,903 | - | 167,903 | |||||||||
| Engineering Parts | - | 1,023,822 | 1,023,822 | |||||||||
| Services | 726,050 | 59,657 | 785,707 | |||||||||
| Australia/Asia | ||||||||||||
| Equipment Sales | 4,259,093 | - | 4,259,093 | |||||||||
| Equipment Rentals | 876,141 | - | 876,141 | |||||||||
| Software Sales | 324,222 | - | 324,222 | |||||||||
| Services | 627,615 | - | 627,615 | |||||||||
| Middle East & Africa | ||||||||||||
| Equipment Sales | 301,165 | - | 301,165 | |||||||||
| Equipment Rentals | 36,130 | - | 36,130 | |||||||||
| Software Sales | 58,826 | - | 58,826 | |||||||||
| Services | 142,597 | - | 142,597 | |||||||||
| Total Net Sales | $ | 12,908,110 | $ | 12,148,824 | $ | 25,056,934 | ||||||
| F-26 |
CODA OCTOPUS GROUP, INC.
Notes to the Consolidated Financial Statements
October 31, 2020 and 2019
NOTE 12 -SEGMENT ANALYSIS (Continued)
| For the Year Ended October 31, 2019 | ||||||||||||
| Marine | Marine | |||||||||||
| Technology | Engineering | Grand | ||||||||||
| Business | Business | Total | ||||||||||
| Total Net Sales by Geographic Area | ||||||||||||
| Americas | $ | 2,625,072 | $ | 10,919,412 | $ | 13,544,484 | ||||||
| Europe | 3,657,249 | 1,229,412 | 4,886,661 | |||||||||
| Australia/Asia | 6,087,071 | - | 6,087,071 | |||||||||
| Middle East & Africa | 538,718 | - | 538,718 | |||||||||
| Total Net Sales | $ | 12,908,110 | $ | 12,148,824 | $ | 25,056,934 | ||||||
| For the Year Ended October 31, 2019 | ||||||||||||
| Marine | Marine | |||||||||||
| Technology | Engineering | Grand | ||||||||||
| Business | Business | Total | ||||||||||
| Total Net Sales by Product Line | ||||||||||||
| Equipment Sales | $ | 6,930,914 | $ | 203,430 | $ | 7,134,344 | ||||||
| Equipment Rentals | 2,688,570 | - | 2,688,570 | |||||||||
| Software Sales | 604,491 | - | 604,491 | |||||||||
| Engineering Parts | - | 10,141,160 | 10,141,160 | |||||||||
| Services | 2,684,135 | 1,804,234 | 4,488,369 | |||||||||
| Total Net Sales | $ | 12,908,110 | $ | 12,148,824 | $ | 25,056,934 | ||||||
NOTE 13 – COMMITMENTS AND CONTINGENCIES
Employment Agreements
Annmarie Gayle
Pursuant to the terms of an employment agreement dated March 16, 2017, the Company employs Ms. Gayle as its Chief Executive Officer on a full-time basis and a member of its Board of Directors. With effect from July 1, 2019, Ms. Gayle’s annual salary was increased from $230,000 to $305,000 payable on a monthly basis. Ms. Gayle is also entitled to an annual performance bonus of up to $100,000, upon achieving certain targets that are to be defined on an annual basis. The agreement provides for 30 days of paid holidays in addition to public holidays observed in Scotland.
The agreement has no definitive term and may be terminated only upon twelve months’ prior written notice by Ms. Gayle. In the event that the Company terminates her at any time without cause, she is entitled to a payment equal to her annual salary as well as a separation bonus of $150,000. The Company may terminate the agreement for cause, immediately and without notice. Among others, “for cause” includes gross misconduct, a serious or repeated breach of the agreement and negligence and incompetence as reasonably determined by the Company’s Board. The agreement includes a 12-month non-compete and non-solicitation provision.
| F-27 |
CODA OCTOPUS GROUP, INC.
Notes to the Consolidated Financial Statements
October 31, 2020 and 2019
NOTE 13 – COMMITMENTS AND CONTINGENCIES (Continued)
Employment Agreements (Continued)
Blair Cunningham
Under the terms of an employment contract dated January 1, 2013, our wholly owned subsidiary Coda Octopus Products, Inc. employs Blair Cunningham as its Chief Executive Officer and President of Technology. He is being paid an annual base salary of $200,000 with effect from January 1, 2020, subject to review by the Company’s Chief Executive Officer. Mr. Cunningham is entitled to 25 vacation days in addition to any public holiday.
The agreement may be terminated only upon twelve-month prior written notice without cause. The Company may terminate the agreement for cause, immediately and without notice. Among others, “for cause” includes gross misconduct, a serious or repeated breach of the agreement and negligence and incompetence as reasonably determined by the Company’s Board. The agreement includes an 18-month non-compete and non-solicitation provision.
Michael Midgley
Pursuant to the terms of an employment agreement dated June 1, 2011, Mike Midgley was appointed the Chief Executive Officer of our wholly owned subsidiary Coda Octopus Colmek, Inc. and our Chief Financial Officer. He is being paid an annual salary of $210,000 subject to an annual review by Colmek’s Board of Directors and the Company’s Chief Executive Officer. Mr. Midgley is entitled to 20 vacation days in addition to any public holiday.
The agreement may be terminated at any time upon 4-month prior written notice. The Company may terminate the agreement for cause, immediately and without notice. Among others, “for cause” includes gross misconduct, a serious or repeated breach of the agreement and negligence and incompetence as reasonably determined by the Company’s Board. The agreement includes a 12-month non-compete and non-solicitation provision. On December 6, 2017, the board of directors of the Company appointed Mr. Midgley to be the Company’s Chief Financial Officer. In connection with this appointment, all rights and obligations under Mr. Midgley’s employment agreement with Colmek were transferred to and have been assumed by Coda Octopus Group, Inc.
Litigation
Currently there is no litigation.
NOTE 14 – PAYROLL PROTECTION PROGRAM
In the 2020 FY certain of our US companies, received a total of $648,871 in Pandemic relief under the US Government Payroll Protection Program (“PPP”). The proceeds from the PPP were used to offset US employees’ salaries during the Pandemic. This amount has now been forgiven under the Program and is recorded in our accounts as “Other Income”.
These amounts were received by our US companies in April and May of 2020. The companies applied for forgiveness of the loans in September 2020 and the loans were forgiven in November 2020.
NOTE 15 – COVID-19
The Company faces various risks related to the global outbreak of coronavirus disease 2019 (“COVID-19”).
The Engineering Services Business is dependent on its workforce to deliver its products and services primarily to the U.S. and U.K. Governments. If significant portions of the Engineering Services Business’s workforce are unable to work effectively, or if the U.S. or UK. Government and/or other customers’ operations are curtailed due to illness, quarantines, government actions, facility closures, or other restrictions in connection with the COVID-19 Pandemic, the Engineering Services Business’s operations is likely be severely impacted. The Engineering Services Business may be unable to perform fully on its contracts and costs may increase as a result of the COVID-19 outbreak. These cost increases may not be fully recoverable either from our customers or under existing insurance policies. At this time, the Company’s management cannot predict with any precision the full extent of the impact which COVID-19 Pandemic will have on the Company, but management continues to mitigate where it can and monitor the situation, to assess further possible implications to operations, the supply chain, and customers, and to take actions in an effort to mitigate adverse consequences. Further, the Pandemic may have a material adverse effect on the Company’s results of operations, financial position, and liquidity in fiscal year 2021.
The Marine Technology Business is dependent on its workforce and/or distributors/resellers to sell and deliver its products and services. Developments such as social distancing, shelter -in- place directives and travel restrictions introduced by governments have impacted the Marine Products Business’s ability to deploy its workforce effectively. These same developments may affect the operations of the Company’s suppliers, Customers and distributors/resellers, as their own workforces and operations are disrupted by efforts to curtail the spread of this virus. The Company, being a manufacturing company, in large part is unable to work remotely. The Company’s activities are performed in certain international locations that are also impacted by the COVID-19 outbreak. While expected to be temporary, these disruptions will negatively impact the Marine Technology Business’s sales, its ongoing development projects, its results of operations, financial condition, and liquidity in 2021.
NOTE 16 – RELATED PARTY TRANSACTION
During the fiscal year ended October 31, 2019, the Company sold our Orlando property to Blair Cunningham an Officer for $705,000 cash. It was determined that this was a fair value for the property based on review of comparable sales. The proceeds of sale were used to purchase the current office/manufacturing facility in Orlando.
NOTE 17 – SUBSEQUENT EVENTS
The Company has evaluated subsequent events occurring through the date that the financial statements were issued, for events requiring, recording or disclosure in the October 31, 2020 consolidated financial statements. Besides the ongoing Pandemic which continues to impact our business, particularly curtailment of our business operations, there are no other material events or transactions occurring during this period requiring recognition or disclosure.
| F-28 |